The analysis of Bitcoin and broader cryptocurrency market activity on May 23, 2025, presents a dynamic and multifaceted picture of the current state of this volatile asset class. With Bitcoin trading above $108,000 at the time of several technical updates and hitting new all-time highs near $111,000, market sentiments and technical indicators are offering insights into price trajectories and momentum shifts. This report seeks to unpack the technical and market analyses shared on this date, drawing on the collective wisdom from different sources and providing a coherent, layered understanding of where Bitcoin and select altcoins stand, what drivers are influencing price action, and what this might mean for investors and traders.
—
Market Setting: Bitcoin’s Price Action and Momentum Landscape
On May 23, 2025, Bitcoin was quoted in the range of approximately $108,500 to $111,500, showing recent volatility with a slight decline noted in some intraday technical measures. The momentum dashboard from one source highlights mixed short- and longer-term signals: a bullish MACD crossover on the 5-minute chart contrasts with bearish divergences and patterns on hourly to daily charts including RSI divergence, bearish engulfing, and ATR expansion indicating increasing volatility or potential pullbacks.
This divergence between short-term bullishness and medium-to-longer-term bearish pressure underscores how Bitcoin markets at this stage are navigating a consolidation or correction phase after recent rapid price surges. The volatile environment means traders need to be alert to oscillations and abrupt reversals, with quick momentum shifts visible at the micro level (5-minute chart) while structural caution remains on daily frames.
—
Technical Architecture and Chart Patterns: Decoding the Signals
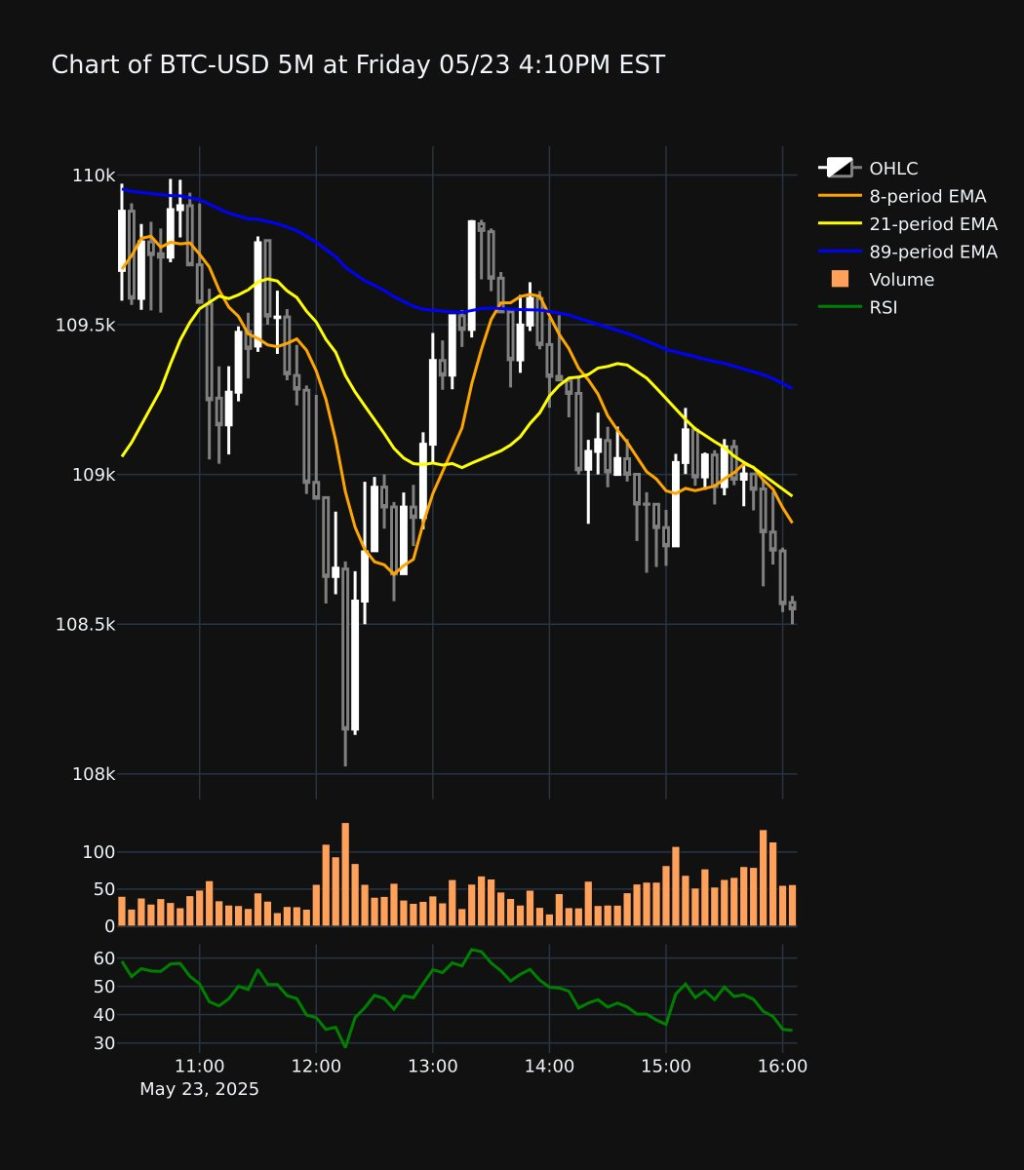
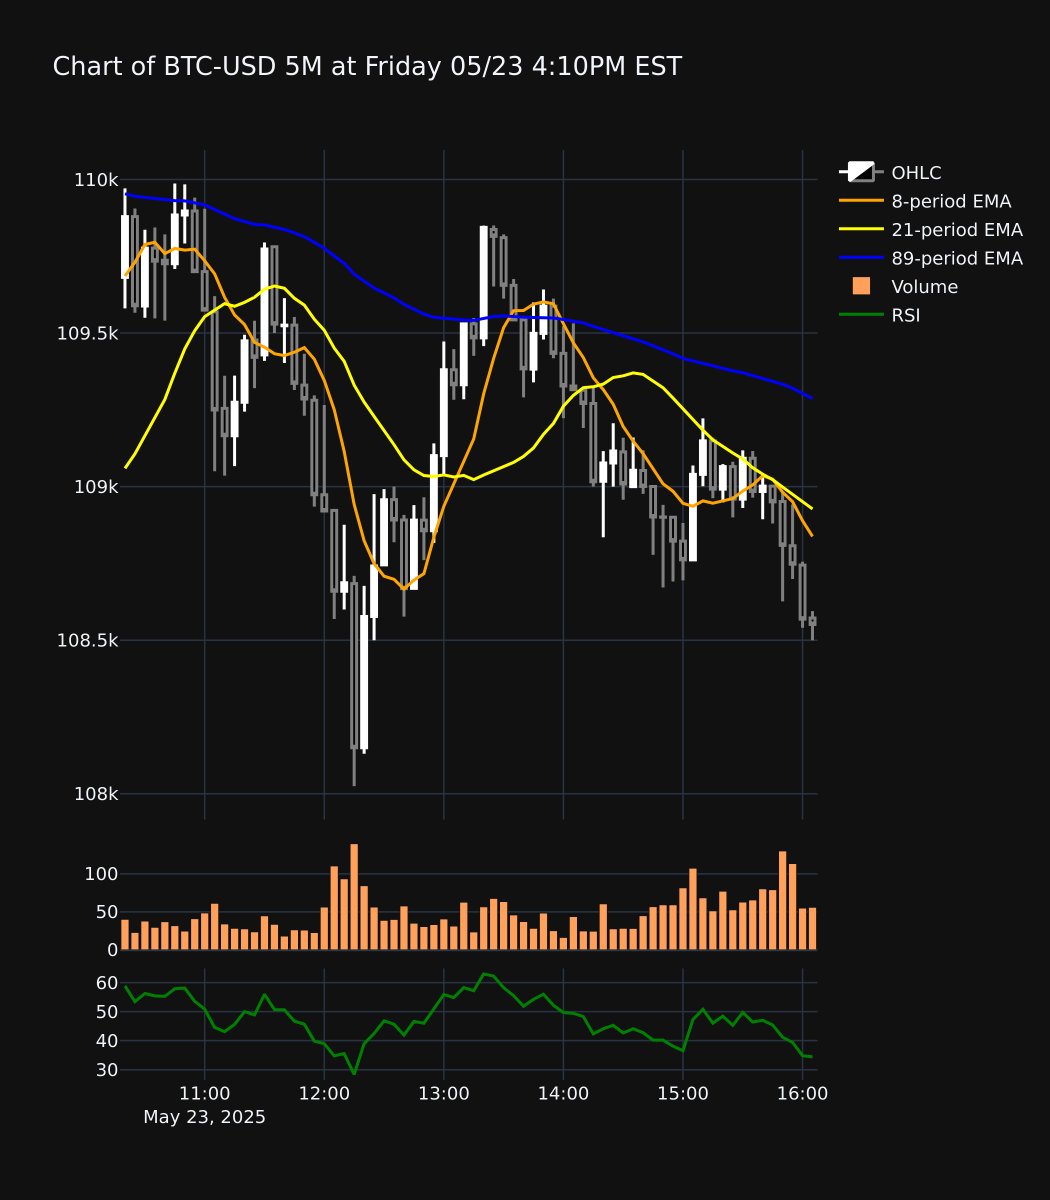
Short-Term Structure: 5-Minute and 1-Hour Frames
The immediate short-term frame has shown bullish signs via the MACD indicator, a momentum oscillator that crossed bullish territory suggesting upward momentum is trying to build. However, the 1-hour frame presents an RSI divergence – a classic warning sign where momentum is not supporting new highs, often preceding pullbacks. The presence of a bearish engulfing bar in the 6-hour chart further implies sellers have gained control over recent candles, emphasizing the likelihood of downward retracements in the near term.
Medium to Long-Term Architecture: Daily Charts and Moving Averages
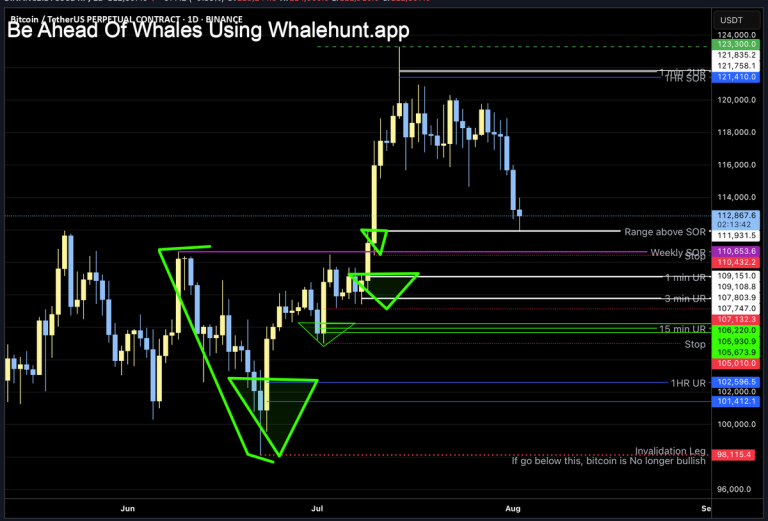
Daily analysis shows ATR (Average True Range) expansion, highlighting elevated volatility. The key moving averages, particularly the 21-day and 50-day MAs, remain bullish with prices holding above these supports, reinforcing the medium-term uptrend despite short-term volatility. Bitcoin has recently broken above a horizontal supply zone, establishing new all-time highs, with market watchers anticipating a retest of this area as support — a critical test for confirming the strength of the current bullish trend.
This pattern suggests a classic breakout and retest scenario familiar in technical analysis: after overcoming resistance, prices temporarily pull back to “test” that zone, which if held, signals confidence among buyers to push higher again. Should this support fail, however, a deeper correction may follow.
—
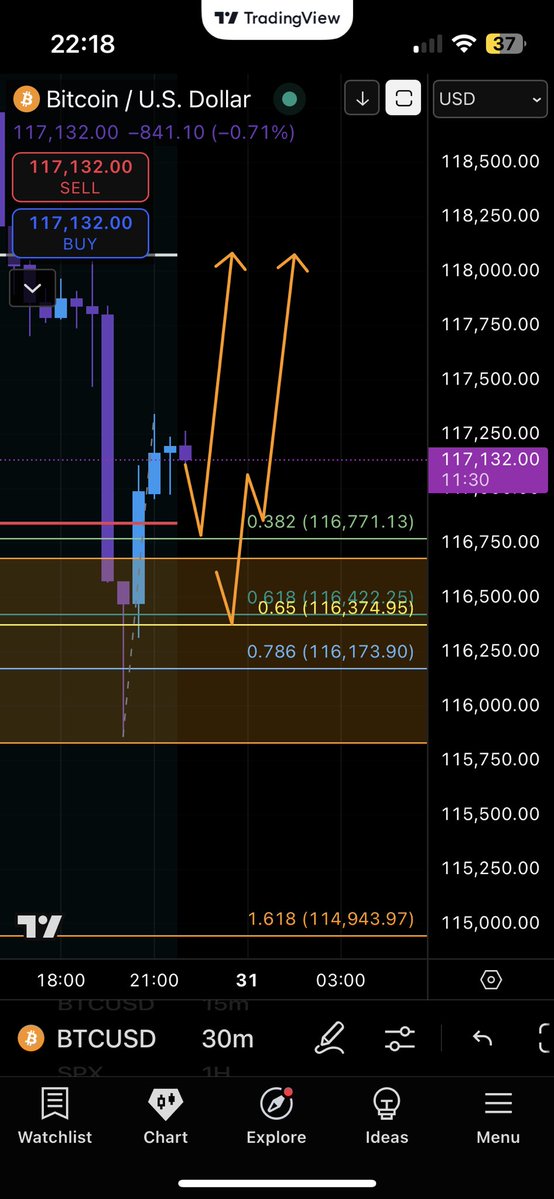
Upside Potential and Price Targets
Optimistic forecasts reflect enormous upside potential in Bitcoin’s price, with top target projections on the order of $220,000 to $512,000 — indicating a possible several hundred percent rise from current levels if bullish momentum persists.[4] Such targets are based on technical modeling of wave theory, historical price structures, and volume analysis. Notably, these come despite the backdrop of increasing volatility and occasional bearish signals.
In conjunction with Bitcoin’s trajectory, altcoins such as Solana (SOL) are also in focus. SOL recently surmounted a significant resistance level near $181.50, only to experience a “fake out” — a liquidity grab pushing prices briefly below resistance before bouncing back. Market participants observe such maneuvers closely as they reveal underlying market psychology and liquidity dynamics driving price action beyond pure fundamentals.
—
Market Sentiment and Psychological Indicators
The broader market context includes a Bitcoin dominance around 62.75%, with the total cryptocurrency market capitalization near $3.52 trillion, indicating a strong continued preference for BTC dominance despite altcoin advances. The Fear and Greed Index is elevated around 76, reflecting bullish investor sentiment but also hinting at potential over-optimism, which can foreshadow corrective phases.
Adding a psychological layer, some traders use non-traditional methods like astrology or energy readings, describing the intra-day energy as “trappy” and “foggy,” expecting sideways or mildly positive price moves — a reflection of how diverse analytical approaches coexist in crypto.
—
Regulatory and Legal Developments Impacting Market Perception
The rejection of a significant $11.9 billion Bitcoin SV lawsuit against Binance by a UK court on May 23 adds a layer of regulatory and legal clarity to the landscape. The court’s stance that investors could have mitigated losses after Binance’s 2019 delisting impacts how exchanges, investor protections, and legal recourses are viewed, potentially reinforcing Binance’s standing and investor confidence in regulated platforms. Such developments are significant because they shape institutional involvement and public trust, which in turn influence price dynamics.
—
Conclusion: Navigating Between Momentum and Caution
Bitcoin’s journey on May 23, 2025, vividly encapsulates the exhilaration and complexity of cryptocurrency markets at record price levels. The ecosystem is balancing on a knife-edge between continued bullish expansion—supported by strong moving averages, market dominance, and ascending new highs—and the emergence of well-defined technical warning signs such as RSI divergences and bearish engulfing patterns.
For investors and traders, this environment demands agile strategies that accommodate rapid shifts; they must leverage technical tools not only to capture upside moves but also to manage risk prudently amid increased volatility. Retests of previous resistance zones as support will be crucial to monitor as they often determine the sustainability of the rally.
Moreover, the interplay between traditional financial forces, technical momentum, and alternative market psychology underlines the rich tapestry that makes crypto markets uniquely challenging yet potentially rewarding. With vast upside targets tempting on one side and cautionary signals on the other, Bitcoin’s path forward remains as fascinating as it is uncertain.
—
Sources
– Unfinished Man. Real-Time Bitcoin Price Monitoring: A Critical Tool for Crypto Market Analysis. https://t.co/LPFGdEYRXZ
– Jaspe. Bitcoin Continues to Flash Bullish Signals: Steady Momentum & Strong Volume. https://t.co/GMK3McPMO7
– Nehal. BTC/USDT Analysis: Break Above Supply Zone and Retest Anticipated. https://t.co/jev8a8L8Eq
– Forexlive & TradeCompass. Bitcoin Futures Key Price Targets & Threshold Analysis. https://t.co/IA4a9ndXyx
– Crypto G. BTC/USDT Analysis – New All-Time High & Bullish Momentum Confirmed. https://t.co/fsNlE81DP6
—
This synthesis integrates the spread of real-time updates, trader insights, technical indicators, and market psychology from May 23 to present an informed, layered view of Bitcoin’s market condition in mid-2025. For participants in the crypto space, continuous monitoring and adaptable strategies remain essential as Bitcoin navigates these powerful but delicate technical waters.