Bitcoin’s recent price activity and technical signals have ignited a whirlwind of speculation and debate within the crypto community. As Bitcoin pushes above key technical levels and flirts with a new all-time high (ATH) territory around $109,400, traders and analysts are confronting a pivotal question: will Bitcoin break decisively through resistance or face a temporary fade? This report delves into the technical landscape, market psychology, and broader macro forces guiding Bitcoin’s next moves, while also touching upon Ethereum’s comparative positioning and altcoin momentum as the market evolves in May 2025.
Bitcoin’s Technical Pulse: Dancing Around the Mid-Bollinger Band
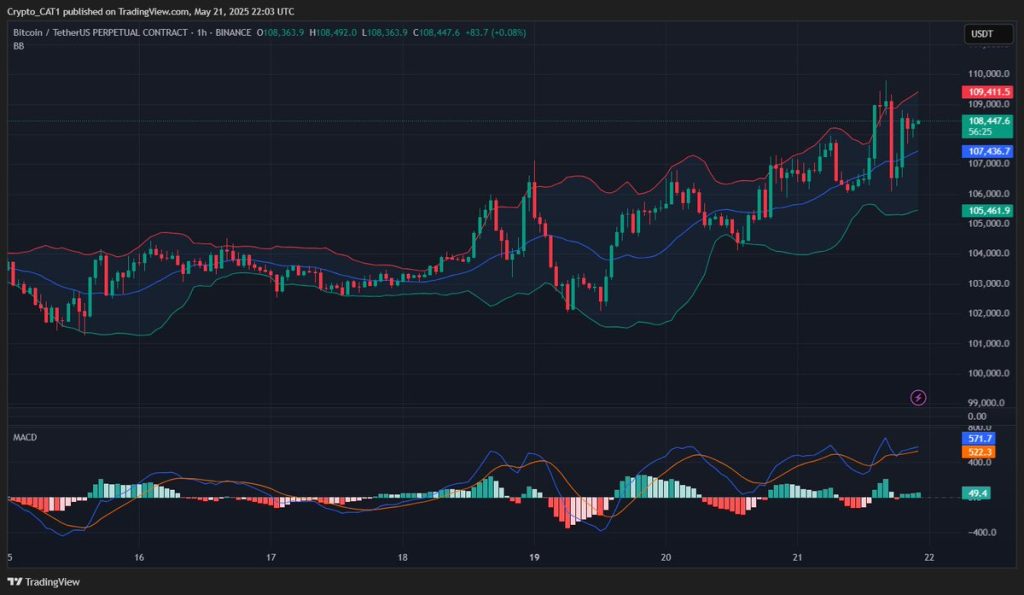
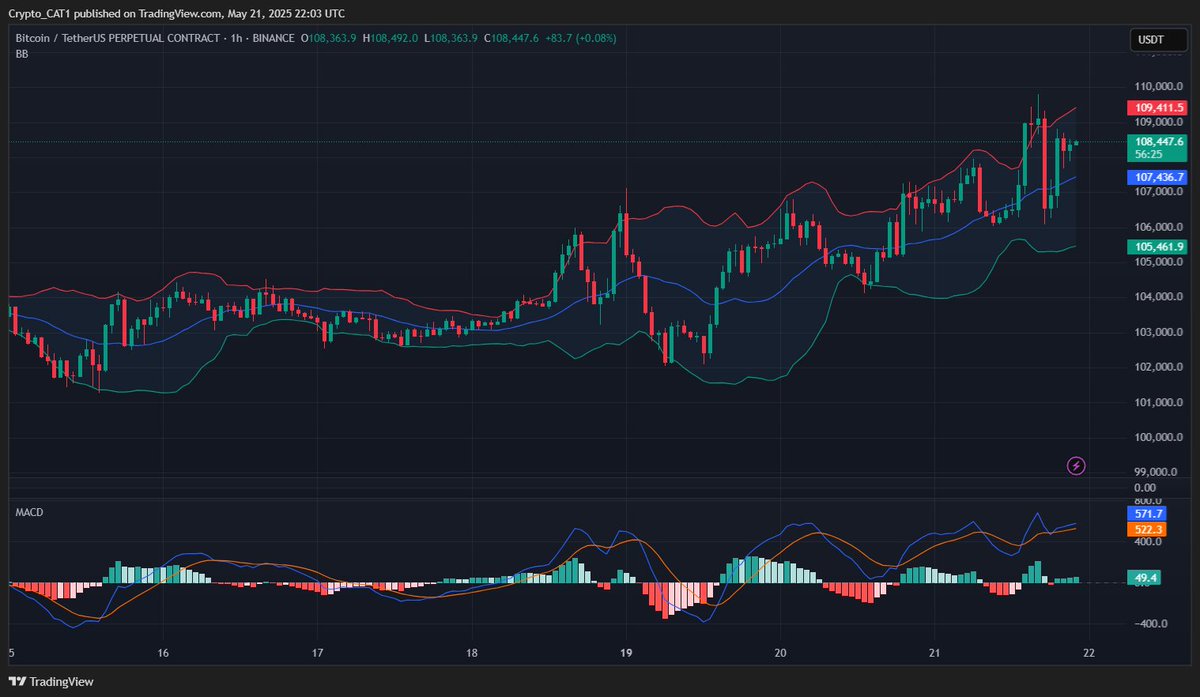
Bitcoin’s price action on the 1-hour chart shows it pushing well above the mid-Bollinger band, a technical indicator that often represents a tipping point between bullish continuation and resistance-induced retracement. The Bollinger bands, which reflect volatility and crowd sentiment, currently encapsulate a price range where Bitcoin’s trajectory appears bullish but precarious [1].
The MACD (Moving Average Convergence Divergence) indicator remains bullish on this short timeframe, suggesting momentum is favoring the bulls for now. Bitcoin’s 25-SMA holding above the 50-SMA consumes this narrative suggesting a slightly bullish trend, albeit within a tight range near $107,000–109,000 [2].
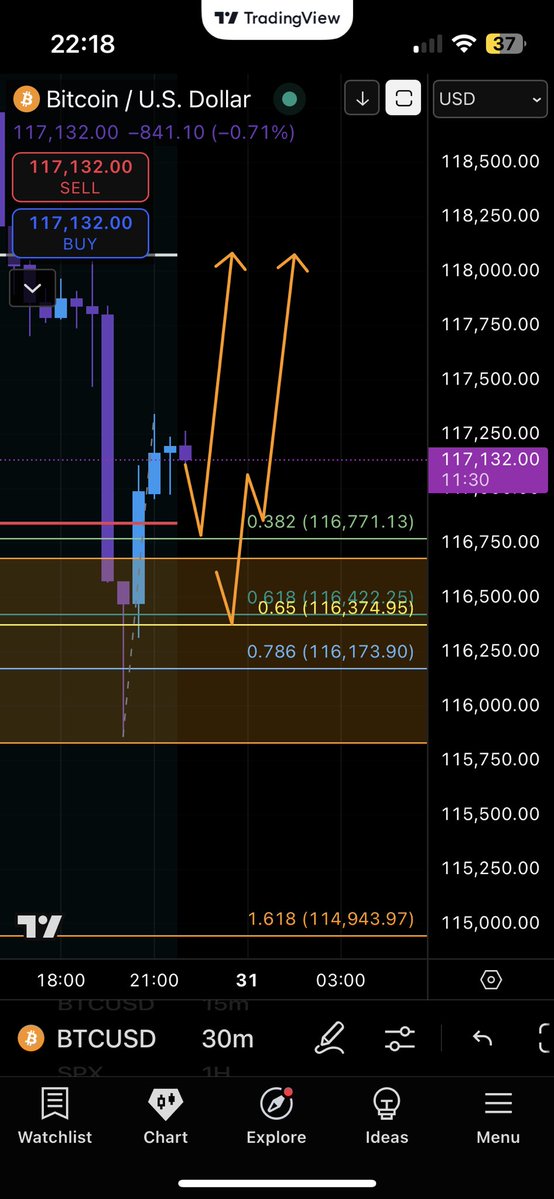
With significant resistance looming around $109,400–110,000, the market is watching keenly. Analysts like Parabolia emphasize the critical decision point: will Bitcoin break this resistance or retreat, testing lower support levels? The recent run-up to just over $109,000 already reflects a powerful velocity of buyers and capital inflow. But is this strength sustainable or a prelude to a retracement?
Key Support and Resistance Zones: Where the Battle Unfolds
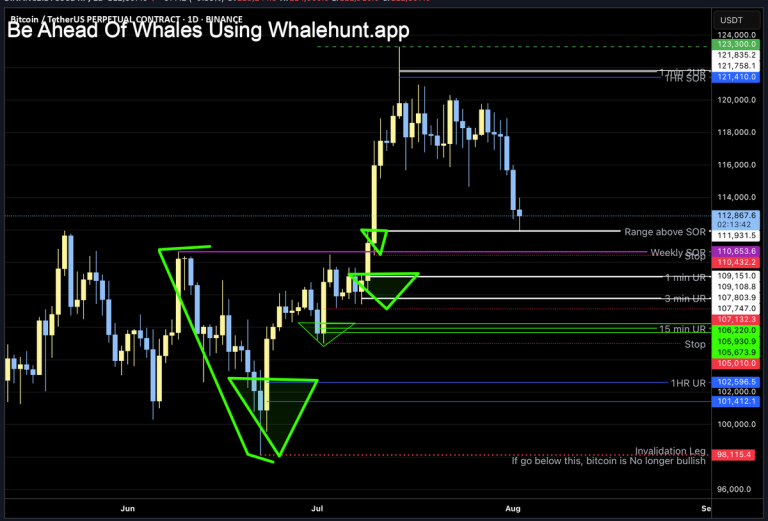
Multiple technical voices highlight important support and resistance structures clustered between $105,000 and $110,000. The Bollinger upper band around $108,000, along with moving averages and recent liquidity zones at $105,600 and $108,000, form a battleground that could determine Bitcoin’s mid-term price direction [3].
Notably, the psychological and technical resistance near $110,000 stands as the next major hurdle. If Bitcoin pushes decisively through this level with convincing volume, it could open the door to new ATHs. However, as indicated by some bearish views, the current high-volume reversal right after hitting the ATH hints at potential profit-taking and a short-term market pullback [4].
This tug-of-war is intensified by institutions and major capital players whose moves often provoke sharp price fluctuations, as noted by commentators emphasizing that the crypto market “doesn’t move by itself” but follows money flows rather than just technical charts [5]. This injection of “conviction capital” at this stage could decisively influence Bitcoin’s near-term fate.
Macro and Market Context: Beyond the Charts
Bitcoin’s price dynamics do not exist in isolation. External macroeconomic conditions are also weighing in, shaping risk appetite and capital allocation. Concerns about global monetary policy shifts, like recent moves by China’s central bank lowering interest rates amid ongoing trade frictions, create an intricate backdrop. Such developments have historically nudged investors toward hard assets including gold and Bitcoin as “safe-haven” alternatives [6].
Geopolitical uncertainty and currency wars—accentuated by rising tensions and competitive currency devaluations—further complicate the landscape. In this environment, Bitcoin’s allure as a decentralized, scarce digital asset is catching renewed attention, potentially driving increased institutional adoption and inflows.
Ethereum and Altcoins: The Broader Crypto Ecosystem
While Bitcoin remains the market bellwether, Ethereum and altcoins like Solana are following their own rhythms. Solana, for example, is currently consolidating after a bullish run, with pullback zones identified near $160 before likely moving higher. This consolidation phase typifies classic trading patterns where altcoins catch breath before resuming upward momentum during what some hope is the altseason: a period of outperformance for alternative cryptocurrencies relative to Bitcoin [7].
Ethereum’s positioning is equally compelling. Technical setups suggest a retest zone between $2430–2450 as a strategic entry point for swing trades, with targets around $2800–3000. Given its robust smart contract ecosystem and dominance in decentralized finance and Web3, Ethereum often serves as a proxy for the health and potential of the broader crypto market. The debate over whether ETH or BTC will outperform continues, fueled by differing narratives regarding adoption, technological upgrades, and macroeconomic sensitivity [8].
The Psychology of Market Players and Institutional Influence
One cannot underestimate market psychology and the impact of institutional capital on cryptocurrency’s short-term moves. Despite technical patterns appearing “perfect,” institutions can introduce volatility and disrupt patterns based on capital flow decisions rather than charts alone. Momentum, conviction, and capital alignment are all necessary to sustain a breakout or rally [9].
This introduces an element of unpredictability that traders must respect: Bitcoin’s bull runs and corrections often hinge on the behavior of major holders and market sentiment shifts. Thus, technical analysis must be combined with an understanding of market mechanics and behavioral finance to craft a comprehensive trading strategy.
Conclusion: Navigating the Crossroads—Breakout or Fade?
Bitcoin stands at a critical crossroads, balancing on the knife-edge above its mid-Bollinger band near $109,000, driven by bullish momentum but pressed by significant resistance. The next moves could be decisive: a successful breakout past $110,000 might ignite a fresh wave of buying and propel new ATHs, fueling market exuberance. Conversely, a failure at resistance could usher in a pullback or consolidation that tests lower support levels and tempers optimism.
Ethereum and altcoins add texture to the narrative, suggesting a maturing crypto ecosystem with differentiated opportunities and risks. While Bitcoin grapples with institutional capital flows, macroeconomic uncertainties, and psychological thresholds, altcoins present potential relative outperformers, albeit with their own volatility.
For traders, investors, and enthusiasts, this moment underscores the necessity of blending technical insights with macro understanding and market sentiment awareness. Bitcoin’s future is never linear; it is a dance of momentum and resistance, conviction and skepticism, capital influx and profit-taking. Watching the levels around $109,400–110,000 will likely define the next chapter in cryptocurrency’s ongoing saga.
—
Sources
[1]: Parabolia Twitter, May 21, 2025 — Bitcoin technical update on Bollinger bands and MACD.
[2]: Shaco AI Twitter, May 21, 2025 — Analysis on Bitcoin’s SMA crossovers and trend on 1h and 4h charts.
[3]: Gem Hunters Twitter, May 21, 2025 — Discussion of Bitcoin liquidity zones and range trading.
[4]: Protrader 365 Twitter, May 21, 2025 — High-volume reversal analysis at Bitcoin’s ATH.
[5]: Web3Born Twitter, May 21, 2025 — Commentary on institutional influence on crypto price action.
[6]: Kanka Analysis Twitter, May 21, 2025 — Macro concerns affecting Bitcoin and gold amid geopolitical tensions.
[7]: Derin Cancar Twitter, May 21, 2025 — Technical setup and consolidation analysis for Solana.
[8]: Ateeq Twitter, May 21, 2025 — Ethereum price retest and swing trade strategy.
[9]: CryptoRobotics Twitter, May 21, 2025 — Insight on challenges to Bitcoin analysis due to market complexity.
Related Links
– Parabolia on Twitter
– Gem Hunters Crypto Analysis
– Bitcoin Market Analysis by Shaco AI
– ProTrader 365 Insights
– Macro Analysis by Kanka
– Ethereum Strategy by Ateeq
– CryptoRobotics Daily Analysis