
The Dance of the Bulls and Bears: A Deep Dive into Current Bitcoin Market Dynamics
Imagine the cryptocurrency market as a grand ballroom. The bulls and bears are dancing, each trying to lead the other. Today, we’re going to put on our dancing shoes and analyze the latest moves in this intricate dance, focusing on Bitcoin (BTC) and its recent price action, funding rates, and market sentiment.
The Current State of Play
The cryptocurrency market is a whirlwind of emotions and data. As of May 3, 2025, Bitcoin has been on a rollercoaster ride. After days of selling pressure, BTC bounced off the $95.8K mark, leaving traders and investors wondering if the bulls are back in the game. Currently, BTC is trading at $96,359, with a trend that has been trending lower from its recent highs [1].
But what’s driving this price action? Let’s dive deeper into the funding rates and market sentiment to find out.
Funding Rates: The Pulse of the Market
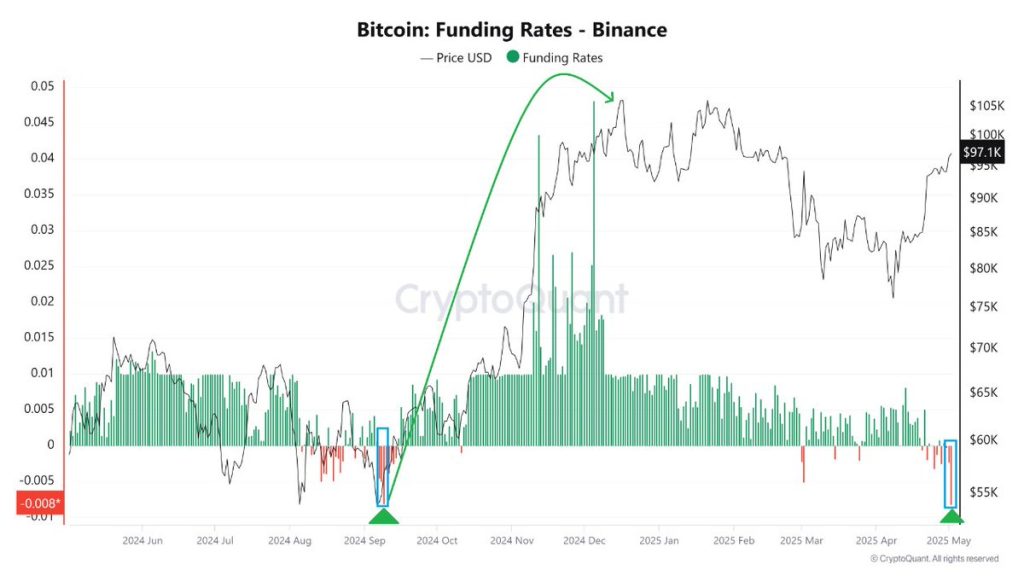
Funding rates are a crucial indicator of market sentiment. They represent the cost of holding a position in the futures market and are influenced by the balance between longs (bulls) and shorts (bears). A positive funding rate indicates that more people are going long, while a negative rate suggests that shorts are dominating.
CryptoQuant recently reported a Binance Bitcoin funding rate of -0.008% [1]. This negative rate is driven by retail shorts, indicating that many traders are betting on a price decline. However, this doesn’t necessarily mean that the bears are in full control. In fact, it could be a sign of a short squeeze waiting to happen.
Whales vs. Retail: The Battle for Control
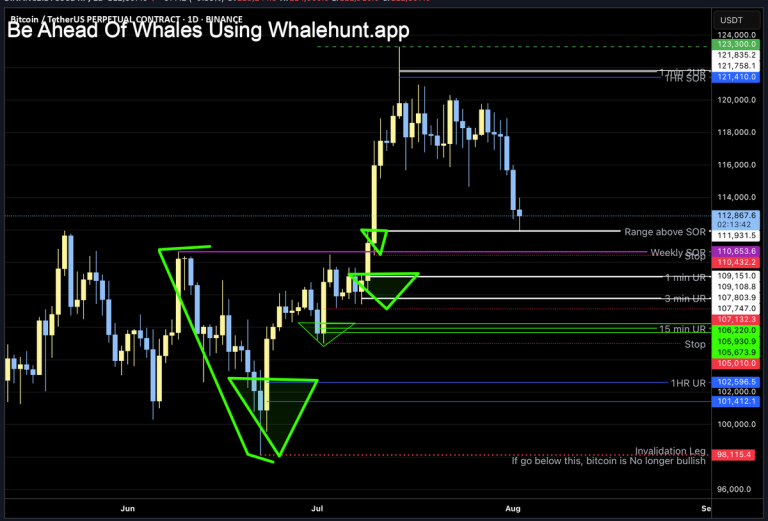
While retail traders are piling into shorts, whales—large holders of Bitcoin—are accumulating BTC. This divergence in behavior can often signal a shift in market dynamics. Whales have deep pockets and a long-term perspective, so their accumulation could indicate that they see value in Bitcoin at these price levels.
This battle between whales and retail traders is a classic example of the “dumb money vs. smart money” narrative. Retail traders, often driven by emotions and short-term price movements, can create opportunities for more patient and informed investors.
Price Action: The Story Unfolds
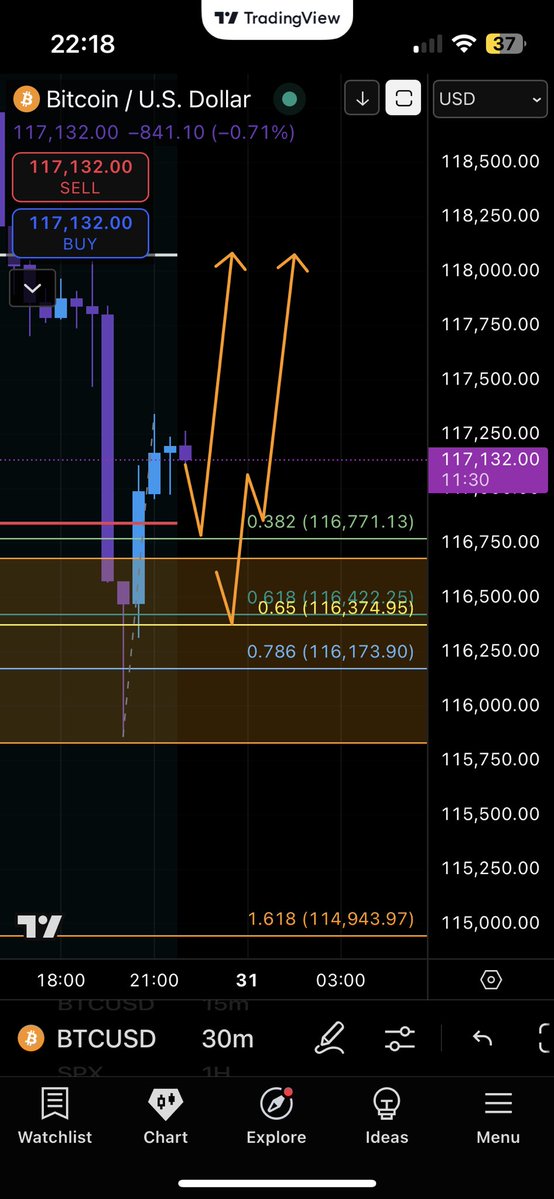
Looking at the 15-minute Binance BTC/USDT chart, we can see that the price has been consolidating after its recent bounce. This consolidation could be a sign of a bullish flag pattern, which is typically a continuation pattern. If the price breaks out to the upside, it could signal that the bulls are indeed back in control.
However, it’s essential to keep an eye on the key support and resistance levels. A break below the recent low of $95.8K could indicate that the bears are still in control, while a move above the recent high of $98,500 could confirm a bullish reversal.
Altcoins: The Understudies
While Bitcoin often steals the show, it’s essential not to overlook the supporting cast—altcoins. As Bitcoin’s price action unfolds, altcoins often follow suit, but they can also carve out their own paths.
Ethereum (ETH), for instance, has been building momentum on its own, with a bullish bias confirmed by sentiment scores [5]. This independent movement could be a sign of a maturing market, where altcoins are no longer just Bitcoin’s shadows but have their own stories to tell.
The Future: A Tale of Two Scenarios
So, where does this leave us? There are two main scenarios to consider:
Conclusion: The Dance Continues
The cryptocurrency market is a complex and ever-changing landscape. As we’ve seen, the dance of the bulls and bears is influenced by a myriad of factors, from funding rates to whale activity to price action. As traders and investors, it’s our job to stay informed, stay vigilant, and stay adaptable.
So, let’s keep our dancing shoes on and our eyes on the market. After all, the dance is far from over. The question is, are you ready to lead, or will you follow?