
Ethereum Network Analysis: A Comprehensive Dashboard and Recent Developments
Introduction
In the dynamic world of blockchain, Ethereum stands as a titan, powering a vast ecosystem of decentralized applications (dApps), smart contracts, and digital assets. To navigate this complex landscape, we’ve crafted a dashboard that provides an intuitive, real-time overview of Ethereum’s mainnet. Let’s delve into this tool and explore recent developments that are shaping the Ethereum ecosystem.
The Ethereum Network Dashboard
At a Glance
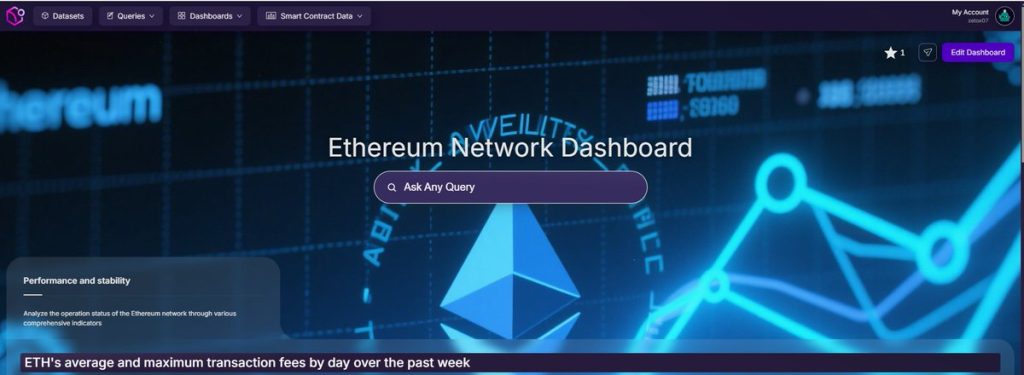
Our dashboard, created using Space and Time’s data platform, offers a bird’s-eye view of Ethereum’s health and activity. Here’s a sneak peek into what it offers:
– Gas Prices: Real-time gas prices to help users understand transaction costs.
– Network Activity: Metrics like transaction volume, new addresses, and active addresses to gauge network engagement.
– Blockchain Performance: Key indicators such as block time, gas used, and uncle rates to assess network efficiency.
– Economic Activity: Data on stablecoin supply, ETH balance changes, and mining revenue to monitor economic trends.
Deep Dive: Gas Prices and Network Activity
Gas Prices: A Tale of Supply and Demand
Gas prices on the Ethereum network are determined by supply and demand. When network congestion increases demand, gas prices rise. Our dashboard helps users understand these fluctuations, enabling them to time their transactions strategically [1].
Network Activity: The Pulse of Ethereum
The dashboard’s network activity metrics provide insights into Ethereum’s user base and adoption. A surge in new addresses, for instance, might indicate a bullish market or the launch of a popular dApp. Meanwhile, active addresses reveal which projects are driving Ethereum’s day-to-day transactions [2].
Recent Developments in the Ethereum Ecosystem
OpenAI’s Geolocation Breakthrough
OpenAI has made waves with its new models (o3 and o4-mini) that can identify geolocations in images with remarkable accuracy. This development could revolutionize image analysis and geotagging, but it also raises privacy concerns [3].
Solana Surpasses Airbnb’s Market Cap
In a significant milestone, Solana’s market capitalization has surpassed that of Airbnb, reaching $72.7 billion. This achievement underscores the growing interest and investment in the Solana ecosystem [3].
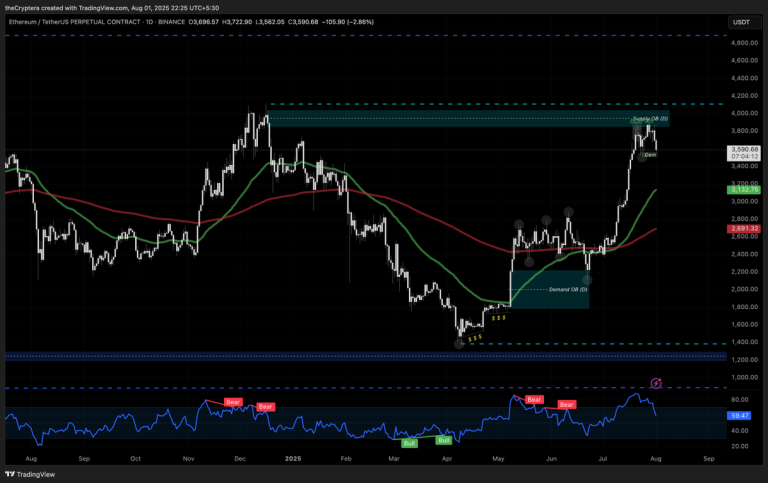
Ethereum Gas Price Trends
Ethereum’s average gas price has been fluctuating, with recent peaks coinciding with market volatility and network congestion. As of April 21, 2025, the average gas price stands at 20.5 Gwei [4].
Analyzing Crypto Projects: A Simple Thread
A recent Twitter thread by @Remexsnipes offers a straightforward method for analyzing crypto projects, helping users spot red flags and find promising gems. The thread is particularly useful for projects in the Solana and Ethereum ecosystems [5].
Etherscan’s Grok: Smart Contract Code Analysis
Etherscan, the go-to platform for Ethereum blockchain data, has introduced Grok, a tool that enables users to read and analyze smart contract code directly on the platform. This feature enhances transparency and understanding of Ethereum-based projects [6].
Conclusion: Navigating the Ethereum Ecosystem
The Ethereum network dashboard and the recent developments discussed in this report provide a comprehensive overview of the Ethereum ecosystem. By leveraging these tools and staying informed about the latest trends, users can make data-driven decisions and navigate the ever-evolving blockchain landscape.
Sources:
[2] Ethereum Blockchain Activity
[3] CoinMarketCap
[4] Ethereum Gas Price History
[5] Twitter Thread: How to Analyze a Project (Minted or Not)
[6] Etherscan Grok
Related Pages:
– Ethereum Foundation
– Ethereum GitHub
– OpenAI
– Solana
– Airbnb
– Etherscan