BTC/USDT 1-Hour Market Update: A Deep Dive
Introduction: The Ever-Changing Landscape of Bitcoin
Imagine standing on the edge of a digital frontier, where the winds of change blow fiercely, and the terrain shifts beneath your feet. Welcome to the world of Bitcoin, the pioneering cryptocurrency that has captivated the imagination of investors, technologists, and dreamers alike. As of April 16, 2025, the BTC/USDT market is a whirlwind of activity, with prices dancing around key levels and sentiments fluctuating like a rollercoaster. Let’s embark on a journey to understand the current pulse of this dynamic market.
The Current Price and Trend Analysis
Bitcoin’s Price: A Snapshot
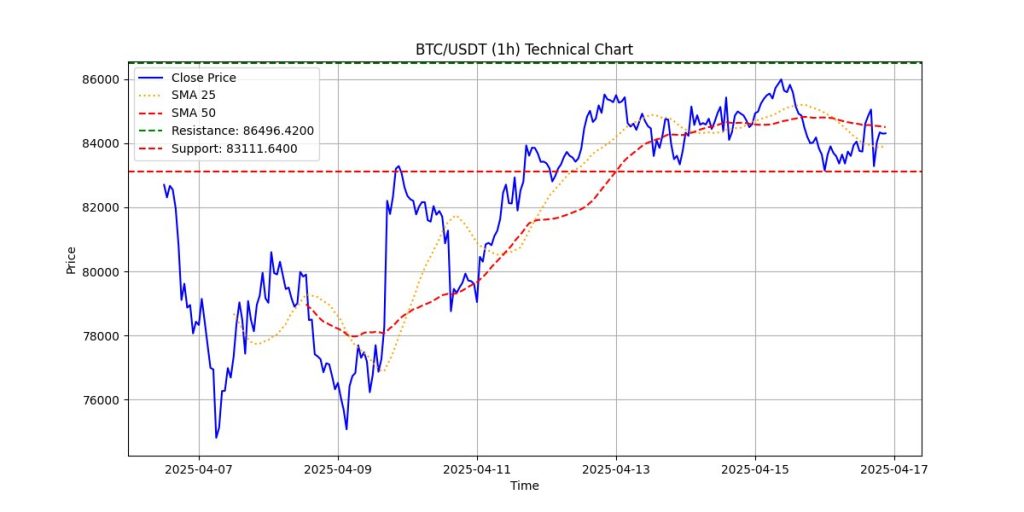
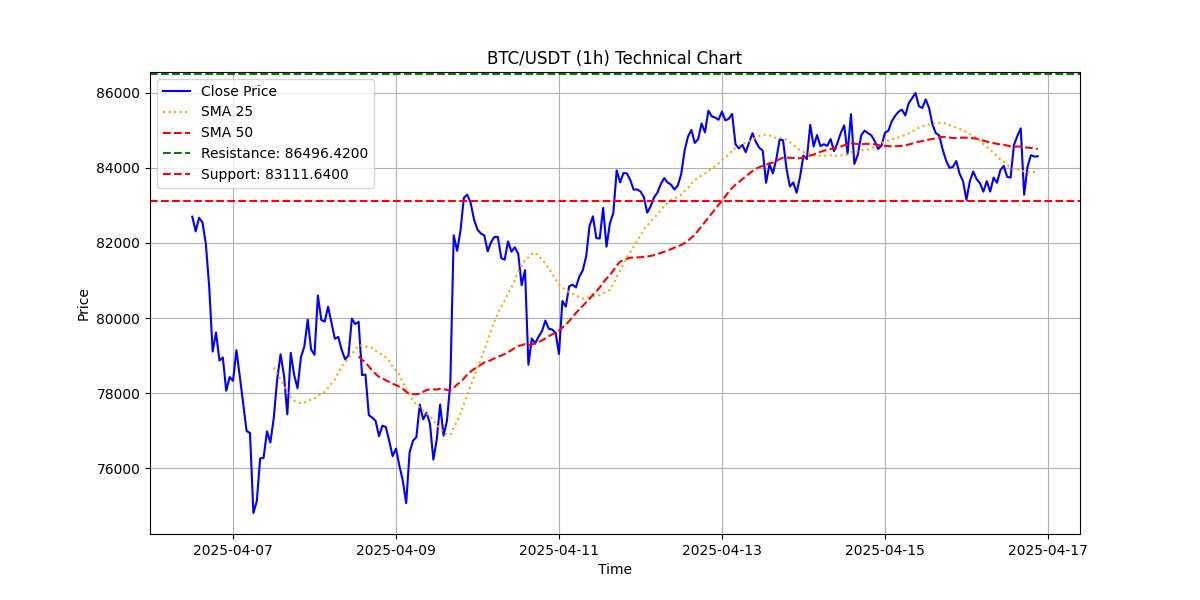
As of the latest update, the price of Bitcoin stands at $84,304.35. This figure is not just a number; it represents the culmination of countless market forces, investor sentiments, and global events. Bitcoin, often referred to as digital gold, has a history of volatility, and this price point is a testament to its resilience and potential for growth.
Trend Analysis: Hopscotch Around Moving Averages
Bitcoin’s price movement can be likened to a game of hopscotch around its moving averages. The price is currently just above its moving averages, indicating a delicate balance between bullish and bearish sentiments. Moving averages are crucial indicators that smooth out price data over a specified period, helping traders identify the direction of a trend.
Sentiment Analysis: Bullish Outlook Amidst Uncertainties
Technical Signals and Investor Behavior
Despite the market uncertainties, current indicators suggest a bullish outlook for Bitcoin. Technical signals, such as the Relative Strength Index (RSI) and the Moving Average Convergence Divergence (MACD), are pointing to potential upward momentum. Investor behavior, driven by a mix of optimism and caution, is also contributing to this bullish sentiment.
The Role of Social Media
Social media platforms like Twitter play a significant role in shaping market sentiment. The correlation between social buzz and market performance is strong, with Bitcoin remaining the most discussed cryptocurrency. Hashtags like #Bitcoin, #Crypto, and #ETH dominate conversations, reflecting the public’s interest and engagement with the market.
Moving Averages: The Cornerstone of Technical Analysis
The 365-Day Moving Average (365DMA)
The 365DMA stands as the ultimate lifeline for long-term Bitcoin bulls. This moving average represents the average price of Bitcoin over the past year, providing a long-term perspective on its price movement. The support level defined by the 365DMA is a critical indicator of market conviction.
The 200-Day Moving Average (200DMA)
Short-term attention is focused on the 200DMA, which represents the average price of Bitcoin over the past 200 days. This moving average is crucial for identifying medium-term trends and potential support or resistance levels. The interaction between the price and the 200DMA can provide valuable insights into the market’s short-term direction.
Price Movements and Market Reactions
The Impact of Powell’s Speech
Recent price movements have been influenced by significant events, such as Federal Reserve Chair Jerome Powell’s speech. The price of Bitcoin rejected exactly from the red zone after Powell’s speech, indicating a strong market reaction to his remarks. This rejection suggests that investors are closely monitoring economic indicators and policy changes, which can impact Bitcoin’s price.
Potential Price Paths
According to various analyses, the price of Bitcoin may continue to follow a blue path, indicating a potential upward trajectory. However, traders must remain cautious, as the market can be unpredictable. The price could also face resistance at key levels, requiring strong volume to break through and continue its upward momentum.
Technical Indicators: A Comprehensive Look
Price Action and Volume
A comprehensive look at Bitcoin’s price action, volume, RSI, and MACD indicators reveals a bullish sentiment with strong support at $83,000. The MACD crossover is signaling potential upward momentum, but traders should remain vigilant for any changes in these indicators.
The Death Cross Scenario
While the bullish scenario is promising, it is essential to consider the bearish scenario as well. The death cross, which occurs when the 50-day moving average crosses below the 200-day moving average, could take over and drag the price down. This scenario highlights the importance of monitoring moving averages and other technical indicators.
Conclusion: Navigating the Bitcoin Market
The Future of Bitcoin
As we stand on the edge of this digital frontier, the future of Bitcoin remains both exciting and uncertain. The market’s volatility, driven by a mix of technical signals, investor behavior, and global events, presents both opportunities and challenges. Whether you are a seasoned trader or a curious observer, understanding the current pulse of the BTC/USDT market is crucial for navigating its ever-changing landscape.
Stay Informed, Stay Vigilant
In the world of Bitcoin, knowledge is power. Staying informed about the latest market trends, technical indicators, and global events can help you make better-informed decisions. Remember, the market is a dynamic entity, and what holds true today may change tomorrow. Stay vigilant, stay curious, and most importantly, stay informed.
—