Bitcoin’s 30% Dip: A Closer Look
Introduction
In the dynamic world of cryptocurrency, a 30% dip in Bitcoin’s price can spark a flurry of activity and speculation. As of March 18, 2025, Bitcoin (BTC) has experienced such a pullback, raising questions about whether this is a typical market correction or a harbinger of a bear market. Let’s delve into the data, analyze historical trends, and explore on-chain metrics to shed light on this recent price movement.
Historical Trends: Bitcoin’s Market Cycles
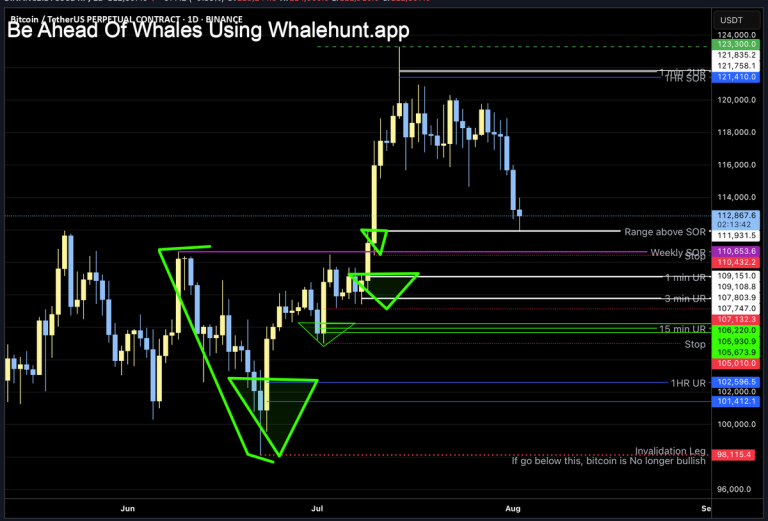
Bitcoin’s price history is a rollercoaster ride of volatility, with cycles of bullish and bearish markets. To understand the current dip, let’s examine Bitcoin’s market cycles using the Signal 365 Moving Average (MA) [1]. This indicator helps identify inflection points in Bitcoin’s price trends over time.
!Bitcoin Price Trends with Signal 365 MA
As seen in the chart, Bitcoin experiences cyclical bull and bear markets. The current dip has brought the price down to around $82,772, which is still significantly higher than the previous bear market low of $3,850 in December 2018 [2]. This suggests that the current pullback could be a normal market correction rather than the start of a new bear market.
Relative Strength Index (RSI) and Market Sentiment
The Relative Strength Index (RSI) is a momentum oscillator that can help determine if an asset is overbought or oversold. A reading below 30 indicates an oversold condition, while a reading above 70 suggests the asset is overbought [3].
As of March 18, 2025, Bitcoin’s RSI is around 40, indicating a neutral to slightly oversold condition. This suggests that the recent dip may present an opportunity for bargain hunters, as the selling pressure might be easing.
On-Chain Data: Liquidity and Exchange Flows
On-chain data provides valuable insights into Bitcoin’s fundamentals and market trends. Let’s examine two key metrics: liquidity and exchange flows.
The Role of News and Sentiment
News events and market sentiment can significantly impact Bitcoin’s price. For instance, Elon Musk’s recent tweets about U.S. financial irregularities and the CryptoQuant CEO’s bearish predictions have contributed to the market’s volatility [6, 7]. However, it’s essential to remember that news-driven price movements are often short-lived and can reverse quickly.
Conclusion: Stay Informed, Stay Calm
In the fast-paced world of cryptocurrency, it’s crucial to stay informed and maintain a balanced perspective. While the recent 30% dip in Bitcoin’s price has raised concerns, historical trends and on-chain data suggest that this could be a typical market correction rather than the start of a new bear market.
As always, it’s essential to do your own research and consider your risk tolerance when making investment decisions. Keep an eye on key metrics, stay updated on news events, and remember that every market cycle has its unique story.
Sources
[1] CryptoQuant – Bitcoin Price Trends with Signal 365 MA
[2] CoinMarketCap – Bitcoin Historical Data
[3] Investopedia – Relative Strength Index (RSI)
[4] CryptoQuant – Bitcoin Liquidity
[5] CryptoQuant – Bitcoin Exchange Inflows and Outflows
[6] Twitter – Elon Musk’s tweets about U.S. financial irregularities
[7] Twitter – CryptoQuant CEO’s bearish predictions
Related Articles
– CoinDesk – Bitcoin Drops Below $85K as Crypto Market Slips
– CoinTelegraph – Bitcoin Price Prediction: Can BTC reach $100K in 2025?
– CryptoQuant – Bitcoin On-Chain Metrics Dashboard