Navigating Bitcoin’s Volatile Waters: A Deep Dive into Market Sentiment and Technical Analysis
Introduction: The Ever-Changing Tides of Bitcoin
Bitcoin, the digital gold of the cryptocurrency world, has always been a rollercoaster of volatility. On August 2, 2025, the market witnessed a flurry of analyses, predictions, and trading strategies—each offering a unique perspective on where the price might head next. From bearish breakdowns to bullish retests, the sentiment was as divided as ever. This report dissects the key insights, technical patterns, and market psychology shaping Bitcoin’s trajectory.
Key Support Levels and Invalidation Zones
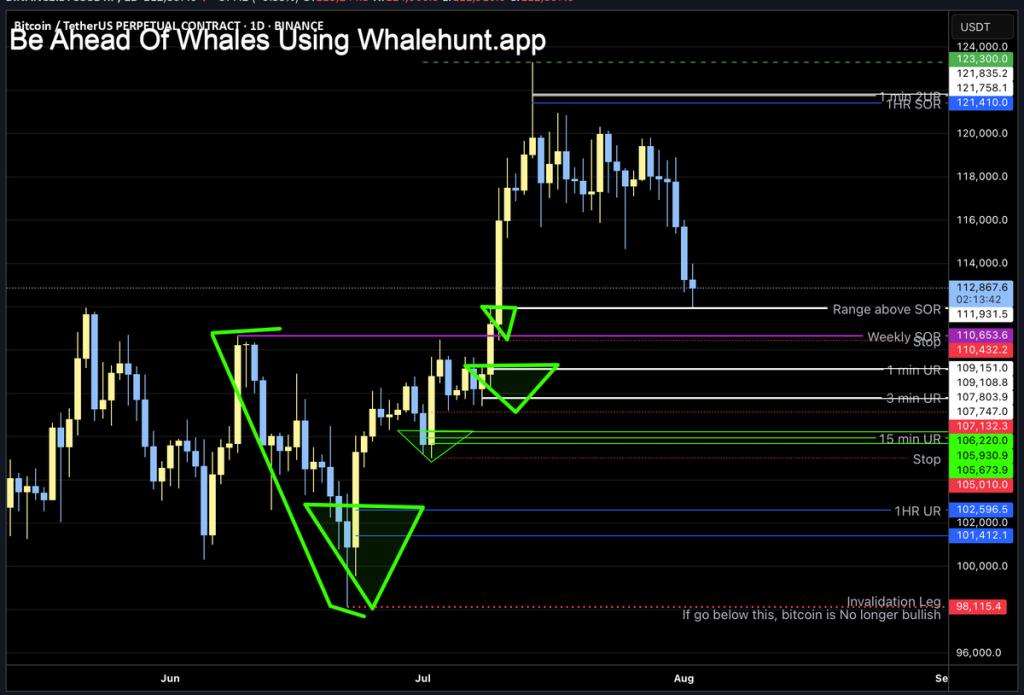
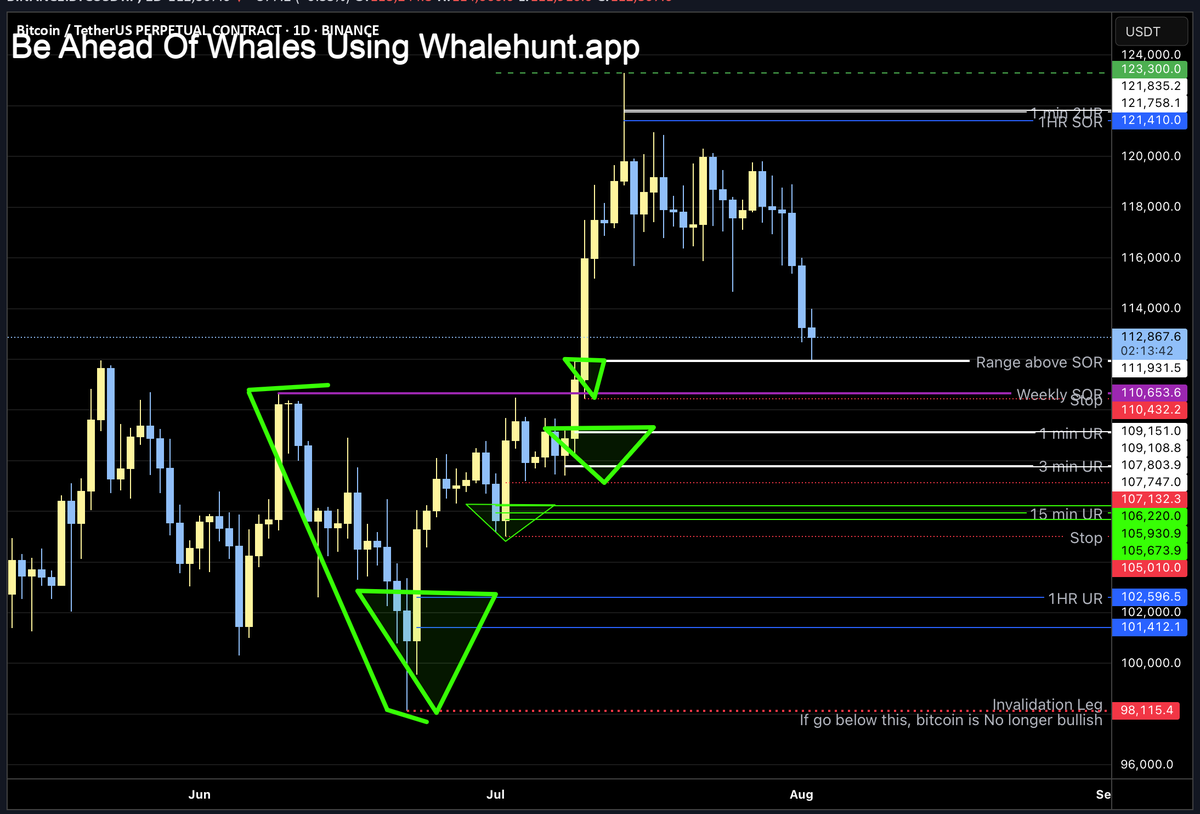
One of the most critical aspects of Bitcoin analysis is identifying key support and resistance levels. Andrew Griffiths, a prominent analyst, highlighted the importance of monitoring the “invalidation leg” [1]. If Bitcoin dips below this level, it could signal the end of the current bull market. This threshold acts as a psychological and technical barrier, where a breakdown could trigger a cascade of sell-offs.
Meanwhile, Mark Edwards provided a detailed breakdown of Bitcoin’s daily chart, noting a bearish break below an ascending trendline, targeting $110,000–$111,000 as key support [7]. This zone aligns with the 78.6% Fibonacci retracement level, a historically significant area for reversals or continued downtrends.
Volatility and Market Sentiment
KakashiCapital emphasized the extremely low volatility in Bitcoin’s price action, suggesting a potential breakout or breakdown in the near future [2]. Low volatility often precedes sharp movements, making it a critical factor for traders to monitor.
On the other hand, Parabolia noted that Bitcoin was grinding lower, hugging the bottom of the Bollinger Bands with an oversold RSI [10]. While a bounce was possible, the overall trend remained bearish, with $112,000 acting as a crucial support level.
Technical Patterns and Trading Setups
Catalyst Traders identified a breakdown from a descending triangle pattern, with the 200MA now acting as resistance [5]. This pattern often signals further downside momentum, reinforcing the bearish sentiment.
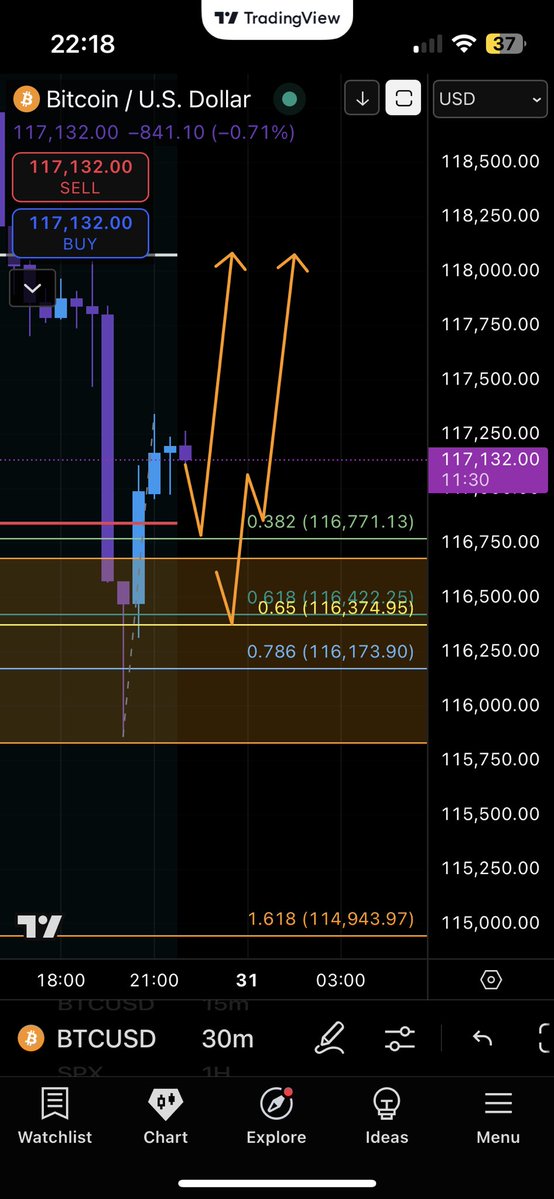
Storm Trading highlighted a potential short trade setup, with Bitcoin entering a weakening bullish momentum phase [6]. The entry was set at $117,646, with a stop loss at $116,911 and a take-profit target at $121,700. This strategy reflects the cautious approach many traders are adopting amid uncertainty.
The Human Factor: Emotions and Market Psychology
Beyond technical analysis, market psychology plays a crucial role in Bitcoin’s price movements. MemeTokenPro humorously noted that most “analysis” is akin to reading tea leaves, with traders often relying on lagging indicators rather than forward-looking insights [12].
Meanwhile, crypTOE dude sarcastically commented on the reliability of stale crypto takes, highlighting the frustration many investors feel when predictions fail to materialize [4]. This sentiment underscores the importance of adaptability in trading strategies.
Conclusion: The Path Forward for Bitcoin
Bitcoin’s price action remains a battleground between bulls and bears, with key support levels acting as the last line of defense. While technical indicators suggest potential downside risks, low volatility and oversold conditions could pave the way for a reversal. Traders must remain vigilant, balancing technical analysis with market sentiment to navigate these turbulent waters.
The future of Bitcoin will be shaped by macroeconomic factors, institutional adoption, and regulatory developments—all of which add layers of complexity to price predictions. As the market evolves, one thing remains certain: Bitcoin will continue to test the resolve of traders and investors alike.
Sources