
Bitcoin and Cryptocurrency Market Analysis: A Comprehensive Overview
Introduction: The Current State of Bitcoin
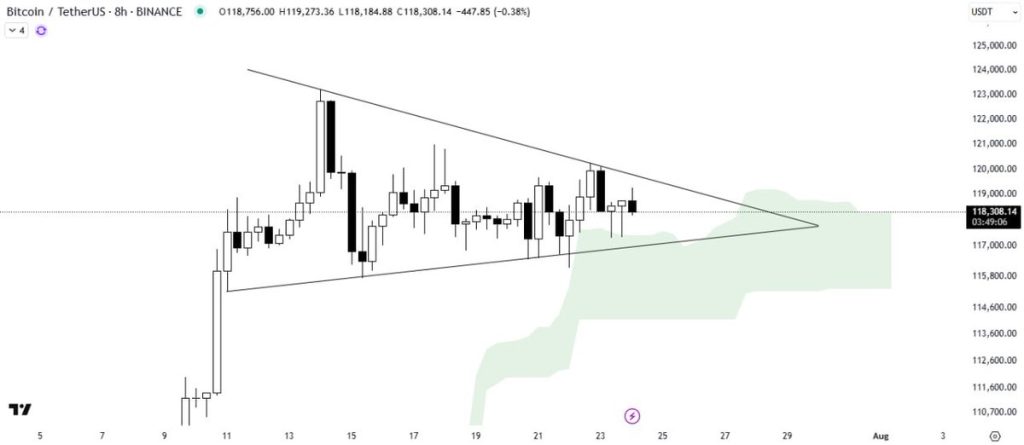
Bitcoin, the world’s leading cryptocurrency, is currently navigating a complex market landscape. As of July 24, 2025, Bitcoin is consolidating within a symmetrical triangle pattern, a technical formation that often precedes significant price movements. The Ichimoku Cloud, a widely respected technical indicator, is acting as support and showing bullish momentum, suggesting that a decisive breakout from the pattern could trigger another bullish rally.
The Symmetrical Triangle and Its Implications
The symmetrical triangle pattern is a classic technical formation that indicates a period of consolidation before a potential breakout. In this pattern, the price of Bitcoin is oscillating between two converging trend lines, creating a triangular shape. This consolidation phase is often characterized by decreasing volatility and trading volume, as traders and investors await a clear directional signal.
The symmetrical triangle can resolve in two ways: a breakout to the upside or a breakdown to the downside. Given the current market context, a breakout to the upside seems more likely, as the Ichimoku Cloud is providing strong support and the overall market sentiment remains bullish. However, traders should remain cautious, as a breakdown could also occur, especially if the market sentiment shifts abruptly.
The Ichimoku Cloud: A Bullish Indicator
The Ichimoku Cloud is a versatile technical analysis tool that provides valuable insights into market trends, support and resistance levels, and potential price movements. In the current market context, the Ichimoku Cloud is acting as a strong support level for Bitcoin, indicating that the bullish momentum is intact.
The Cloud is composed of two lines, Senkou Span A and Senkou Span B, which are calculated based on the average of the highest high and lowest low over a specific period. When the price of Bitcoin is above the Cloud, it is generally considered a bullish signal, as it indicates that the market sentiment is positive and the price is likely to continue rising. Conversely, when the price is below the Cloud, it is considered a bearish signal.
In the current market context, the price of Bitcoin is above the Cloud, and the Cloud itself is sloping upwards, indicating a strong bullish trend. This bullish momentum is further supported by the fact that the Conversion Line (Tenkan-sen) is above the Base Line (Kijun-sen), another bullish signal in the Ichimoku system.
The $120K Test: A Key Level for Bitcoin
According to a 42-indicator analysis by ChatGPT, Bitcoin is currently testing a key level at $120,000. This level is significant for several reasons. Firstly, it represents a psychological barrier for many traders and investors, as it is a round number and a new all-time high for Bitcoin. Secondly, it is a level where significant liquidity is expected to be present, as many traders and investors are likely to have placed buy or sell orders around this price.
The $120K test is also significant in the context of the current market cycle. Bitcoin has been in a strong bullish trend for the past year, driven by institutional adoption, smart money accumulation, and a surge in on-chain activity. However, the market is currently experiencing a period of consolidation, as traders and investors take profits and await a clear directional signal.
The $120K test will be a crucial level to watch in the coming days and weeks. If Bitcoin is able to break above this level, it could trigger a new wave of buying and send the price to new all-time highs. However, if the price fails to break above this level and instead breaks down below the symmetrical triangle, it could signal a shift in market sentiment and a potential correction.
The Rising Wedge: A Cautionary Signal
While the overall market sentiment remains bullish, some technical analysts are warning of a potential rising wedge formation in the Bitcoin chart. A rising wedge is a bearish reversal pattern that occurs when the price of an asset is making higher highs and higher lows, but the trend lines are converging, indicating a loss of momentum.
In the current market context, the rising wedge is not yet confirmed, as the price of Bitcoin is still within the symmetrical triangle pattern. However, traders should be aware of this potential formation and monitor the price action closely. If the price of Bitcoin breaks down below the lower trend line of the symmetrical triangle, it could confirm the rising wedge and signal a potential correction.
The Bull Flag Breakout: A Potential Target of $130K–$135K
Despite the cautionary signals, some technical analysts are still bullish on Bitcoin and are predicting a potential bull flag breakout. A bull flag is a continuation pattern that occurs when the price of an asset consolidates after a strong rally, forming a small flag-like pattern. The breakout from this pattern often leads to a continuation of the previous trend.
In the current market context, the symmetrical triangle pattern could be interpreted as a bull flag, as it is occurring after a strong rally that took Bitcoin to new all-time highs. If the price of Bitcoin is able to break out of the symmetrical triangle to the upside, it could target the next resistance level at $130,000–$135,000.
This target is based on the height of the flagpole, which is the distance between the previous swing low and the breakout point. In this case, the flagpole is approximately $15,000, which, when added to the breakout point, would target the $130,000–$135,000 range.
The Altseason Uncertainty: A Potential Headwind for Bitcoin
While Bitcoin is consolidating and testing key levels, the broader cryptocurrency market is experiencing a period of uncertainty. The term “altseason” refers to a period in the cryptocurrency market where alternative coins (altcoins) outperform Bitcoin and experience significant price appreciation.
In the current market context, there are signs that an altseason may be underway, as many altcoins have been experiencing strong price appreciation in recent weeks. This rotation into altcoins could potentially put pressure on Bitcoin’s dominance, as traders and investors reallocate their portfolios to take advantage of the altseason.
However, it is important to note that altseasons are often characterized by high volatility and speculative trading, and they can be short-lived. As such, traders and investors should be cautious when allocating capital to altcoins and should closely monitor the market dynamics.
The Institutional Surge: A Bullish Factor for Bitcoin
Despite the altseason uncertainty, Bitcoin continues to benefit from strong institutional adoption. In recent months, there has been a surge in institutional treasury surges, as companies and investment funds allocate capital to Bitcoin as a hedge against inflation and a store of value.
This institutional adoption is a significant bullish factor for Bitcoin, as it brings in large amounts of capital and liquidity to the market. It also signals a shift in the perception of Bitcoin, as it is increasingly being recognized as a legitimate asset class by traditional financial institutions.
The Smart Money Accumulation: A Bullish Signal
In addition to the institutional surge, there has been significant smart money accumulation in the Bitcoin market. Smart money refers to the capital and trading activity of sophisticated investors and traders who have a deep understanding of the market and are able to anticipate price movements.
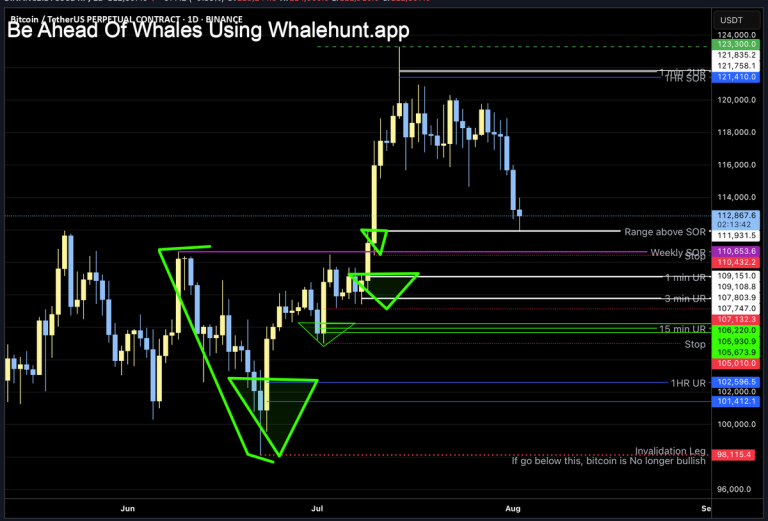
The smart money accumulation is evident in the on-chain data, which shows that large holders of Bitcoin, known as whales, have been accumulating significant amounts of Bitcoin in recent months. This accumulation is a bullish signal, as it indicates that sophisticated investors are confident in the long-term prospects of Bitcoin and are positioning themselves accordingly.
The Ethereum Parallel: A Potential Bullish Catalyst for Bitcoin
Interestingly, the current market structure of Ethereum, the second-largest cryptocurrency by market capitalization, bears a striking resemblance to Bitcoin’s market structure in 2020. In 2020, Bitcoin experienced a strong breakout from a descending broadening wedge, a technical formation that is characterized by a series of higher highs and lower lows, but with a broadening range.
In the current market context, Ethereum is also forming a descending broadening wedge, and a strong breakout from this pattern could potentially trigger a significant rally in the price of Ethereum. This rally could have a positive spillover effect on the broader cryptocurrency market, including Bitcoin, as it could attract more capital and liquidity to the market.
The GOAT Network: A Potential Solution for Bitcoin’s Idle Status
While Bitcoin has largely remained an underutilized asset, there are emerging solutions that aim to unlock its potential. One such solution is the GOAT Network, which is revolutionizing Bitcoin’s yield potential by providing a decentralized platform for lending, borrowing, and staking.
The GOAT Network aims to address the idle status of Bitcoin by enabling users to earn yield on their Bitcoin holdings, thereby increasing the utility and adoption of the asset. This could potentially attract more capital to the Bitcoin market and drive further price appreciation.
The Fed’s Dilemma: A Bullish Catalyst for Bitcoin
In a recent statement, Federal Reserve Chairman Jerome Powell acknowledged that the Fed may find itself in a challenging scenario in which its dual-mandate goals of maximum employment and price stability are in tension. This admission highlights the potential for a shift in monetary policy, which could have significant implications for the cryptocurrency market.
In particular, a shift towards a more accommodative monetary policy, such as a pause in interest rate hikes or a potential rate cut, could be bullish for Bitcoin and the broader cryptocurrency market. This is because accommodative monetary policy tends to increase liquidity and drive capital towards risk assets, including cryptocurrencies.
The $9 Billion Short Squeeze: A Potential Explosive Setup
According to the latest liquidation heatmap from Coinglass, there is a highly explosive technical setup in the Bitcoin market. Over $9 billion in short positions could be wiped out if Bitcoin breaks above $125,000. This potential short squeeze could trigger a significant rally in the price of Bitcoin, as short sellers are forced to cover their positions and buy back the asset.
Conclusion: The Path Forward for Bitcoin
In conclusion, the Bitcoin market is currently navigating a complex landscape, with a symmetrical triangle pattern, the Ichimoku Cloud acting as support, and a key $120K test on the horizon. While there are cautionary signals, such as the potential rising wedge and the altseason uncertainty, there are also significant bullish factors, such as the institutional surge, the smart money accumulation, and the potential short squeeze.
As such, traders and investors should closely monitor the price action and the key levels, and be prepared for potential volatility. The breakout from the symmetrical triangle will be a crucial event to watch, as it could signal the next major move in the Bitcoin market. Whether it is a bullish breakout or a bearish breakdown, the market is likely to provide clear signals in the coming days and weeks.