
Decoding Ethereum’s Price Action: What the Latest Chart Signals Mean
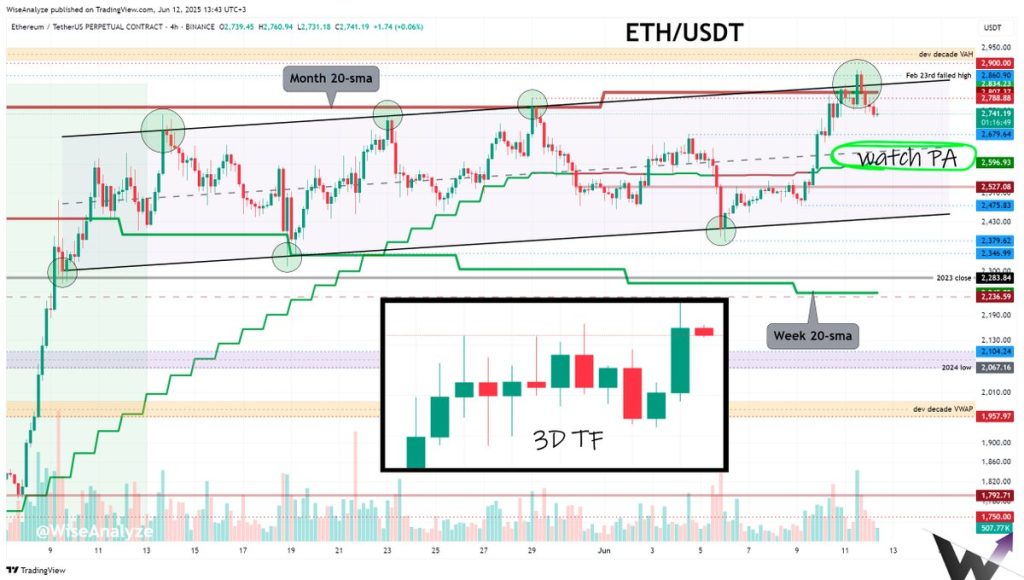
Ethereum, one of the most closely watched cryptocurrencies, continues to captivate traders and investors with its price swings and technical patterns. The recent technical analysis shared by Zen (@WiseAnalyze) highlights some pivotal moments for $ETH that shed light on potential near-term movements. At the heart of this analysis lies Ethereum’s interaction with the monthly 20-SMA (Simple Moving Average)—a key technical indicator traders use to gauge momentum and trend strength.
Let’s unpack what this means for Ethereum’s price trajectory, the implications of moving averages, and the broader context that may shape Ethereum’s journey ahead.
—
Understanding the Monthly 20-SMA and Its Significance
First things first: what is the monthly 20-SMA? It’s a simple moving average calculated over the last 20 months of closing prices. It smooths out volatility and presents a trend-following signal. When Ethereum tries to break above this line, it indicates buyers are pushing the price toward an uptrend or bullish momentum. Conversely, rejection at this level suggests selling pressure or resistance that might prevent further upward moves.
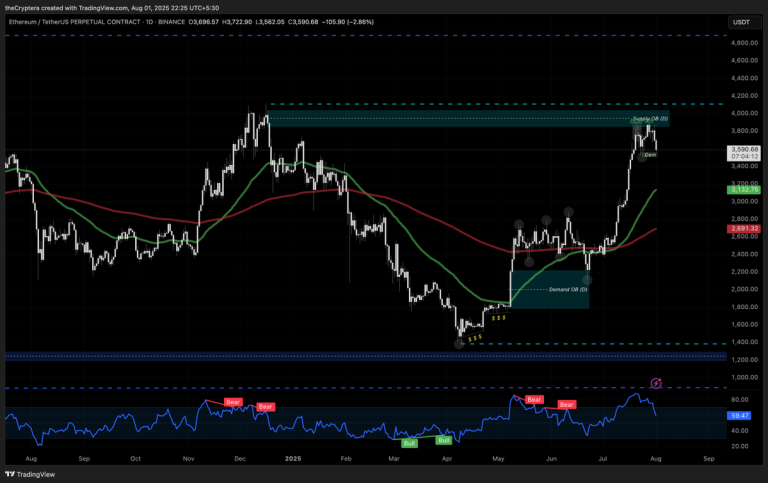
According to Zen’s analysis, Ethereum attempted twice to break above the monthly 20-SMA within a single day but faced rejection both times. This repeated failure can be interpreted as a key resistance point, hinting towards short-term weakness or an inability to maintain bullish momentum beyond this threshold.
—
What Does the “Middle of the Range” Mean?
The report further indicates that Ethereum is likely to decline toward the “middle of the range,” which corresponds approximately with the daily 20-SMA. Why is this important? Whereas the monthly 20-SMA reflects longer-term price trends, the daily 20-SMA captures recent price dynamics and often acts as a pivot point for short-term traders.
Crossovers between moving averages—where the shorter-term daily 20-SMA crosses over or under another moving average—serve as “alarms” or signals that the market trend might be shifting. Zen’s mention of a “crossover alarm” waiting suggests traders should watch for this potential transition, which could confirm a shift in momentum.
In essence, the price is bouncing between monthly and daily averages, creating a dynamic tension zone where the market’s next move will likely be decided.
—
The Broader Technical Context for Ethereum
Moving averages are just one piece of the puzzle. Ethereum’s price movements are also subject to broader market factors like trading volume, market sentiment, and macroeconomic influences such as regulatory developments or demand for decentralized applications.
When a coin as large and liquid as Ethereum tests a critical technical level like the monthly 20-SMA, it sets the tone for the days or weeks ahead:
– If Ethereum manages to overcome this resistance decisively, it could spark a renewed rally as renewed investor confidence and technical buying push prices higher.
– Failing to break past this resistance could see the price drift downward, triggering short-term bears and profit-taking that pull prices back toward support levels such as the daily 20-SMA or other key zones.
Traders often watch for convergence with additional indicators—like RSI (Relative Strength Index) or MACD (Moving Average Convergence Divergence)—to confirm moves. However, the primary focus here remains on the relationship between price and moving averages as a reliable trend gauge.
—
The Psychological Impact: What Repeated Rejections Signal to Traders
Repeated rejection at a significant resistance level like the monthly 20-SMA is not just about numbers; it causes psychological ripples in the trading community.
– Bullish traders might lose conviction if multiple attempts to break this resistance fail, leading them to reduce exposure or place exit orders.
– Bears, on the other hand, are emboldened by the rejection and may push for further downside, amplifying selling pressure.
This tug-of-war contributes to volatility and sets the stage for a breakout or breakdown. Traders and investors alike often watch these levels for clues about market sentiment and future direction.
—
Jerry the Turtle and the Path to Financial Freedom
Switching gears, Alexander’s tweet referencing Jerry the turtle on Ethereum adds a colorful metaphor to the market narrative. The “next stop for Jerry is $100 million market cap,” he claims, implying remarkable growth potential, especially if one considers this figure as part of the path toward “financial freedom.”
While this is more symbolic than technical, it highlights an essential aspect of crypto investing—the belief in growth stories and community figures (like Jerry the turtle) that symbolize steady progress or iconic assets. It’s a reminder that beyond charts and indicators, emotional and social factors play a massive role in shaping market dynamics.
This playful tone contrasts the detailed and often stoic nature of technical analysis, underscoring that crypto markets are as much about narratives and psychology as about price action.
—
Conclusions: Navigating Ethereum’s Near-Term Road
Ethereum’s attempt to breach the monthly 20-SMA and subsequent rejection serve as a crucial signal that traders should watch carefully. It signals a critical negotiation between buyers and sellers, one that will likely dictate Ethereum’s trajectory in the coming weeks.
The possibility of a decline toward the daily 20-SMA suggests caution for those involved in short-term trades while opening opportunity spaces for strategic investors watching for a breakout or further correction.
Ultimately, the interplay of technical signals (like moving averages), psychological factors (like repeated rejection), and market narratives (like the “Jerry the turtle” metaphor) exemplify the multifaceted nature of Ethereum trading.
As these elements converge, investors must synthesize the data, remain attuned to evolving market conditions, and prepare to act decisively when the market resolves this tension. Ethereum’s journey is far from predictable, but understanding these signals can tilt the odds in favor of informed decision-making.
—
Sources
– Zen (@WiseAnalyze) Tweet on Ethereum Technical Analysis
– Alexander (@Ampinla) Tweet on Jerry the Turtle and Market Cap
(Note: Specific tweet URLs are placeholders referring to the tweets referenced in the analysis.)