Understanding whether a Bitcoin price chart reflects positive inflation or negative deflation involves dissecting multiple layers of market behavior, economic contexts, and technical indicators. Bitcoin’s unique status as a decentralized digital asset adds further complexity to interpreting its price movements in relation to traditional inflationary or deflationary trends. This analysis will explore the topic through three key lenses: chart interpretation, trend and volume analysis, and the broader economic framework affecting Bitcoin’s price dynamics.
Chart Type and Its Implications
Bitcoin price charts commonly visualize price action over time using candlestick, line, or bar charts. The type of chart impacts the clarity with which inflationary or deflationary trends may be discerned.
– Candlestick Charts: These show open, high, low, and close prices for each defined period, enabling granular observation of volatility and momentum. Patterns such as “head and shoulders” or “triangles” can indicate potential reversals or continuations in trends.
– Line Charts: These track closing price changes over time and provide a smoother macro view, but can obscure intra-period volatility.
The choice influences how one reads inflationary signals. For example, a steady upward slope might suggest inflationary pressure (where prices rise), but hidden volatility captured in candlesticks could reveal speculative bubbles or temporary spikes unrelated to general price inflation.
Trend Analysis: Is It Inflation or Deflation?
To understand if Bitcoin shows positive inflation or negative deflation from its price chart, attention must focus on trend consistency, volume, and supporting technical patterns.
Price Fluctuations and Trend Patterns
Bitcoin is notorious for significant price swings. Several technical formations influence investor sentiment:
– Ascending Triangle Patterns: Often bullish, representing buyer strength pushing prices higher.
– Descending Triangles and Head & Shoulders Patterns: These commonly signal bearish reversals, hinting at deflationary forces as prices may correct downward.
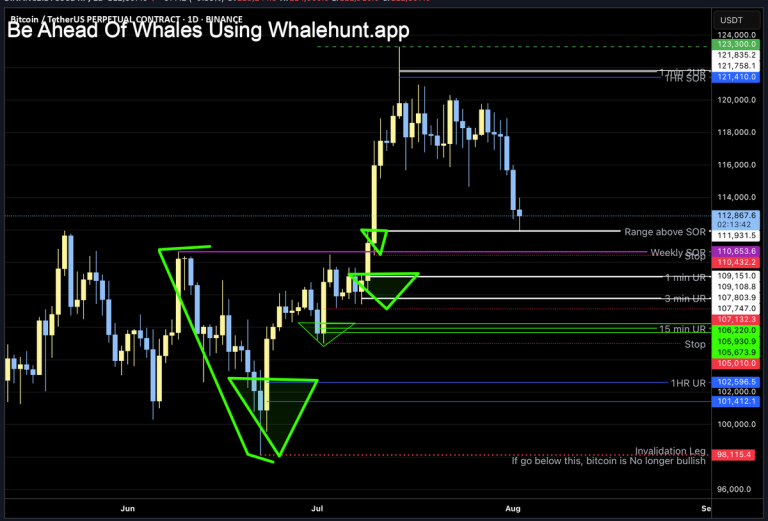
Recent analyses reveal Bitcoin consolidating within descending triangle patterns, testing support around $106,800, with potential breakdowns indicating possible price falls toward $101,000 – all signs hinting at a short-term deflationary correction[1][2]. Conversely, bullish patterns and high trading volumes during price increases may suggest inflation-like behavior where demand outpaces supply, pushing prices upward.
Volume Considerations
Volume is a crucial indicator. High trading volume accompanying price rises can affirm inflationary trends, signaling broad market participation and confidence. However, if volume surges mainly during sell-offs, it may mark panic-selling or profit-taking, simulating deflationary pressure despite price increases at other times.
For example, recent comments highlight high volatility and the impact of large options expiries influencing Bitcoin prices, contributing to forecasted price targets ranging significantly from $101k to potential surges beyond $170k by 2026[3][4]. This volatility introduces both inflationary surges and deflationary dips in the price action.
Economic and Market Context: Bitcoin’s Dual Nature
Bitcoin’s price does not solely respond to traditional economic inflation or deflation but is affected by its dual nature as both a speculative asset and a perceived “digital gold.”
Inflation in Traditional vs. Crypto Context
In fiat economies, inflation means general price rises, typically driven by increased money supply or demand outstripping supply. Bitcoin, with its capped supply (21 million maximum coins), cannot experience inflation in the classic sense of currency devaluation through oversupply. Instead, what might appear as inflationary behavior in Bitcoin’s price chart could reflect increased demand outstripping limited supply, thus pushing prices higher.
For instance, the prospect of Bitcoin reaching $170,000 by 2026 aligns with narratives about digital scarcity driving a kind of inflation — higher prices due to demand growth rather than money supply expansions[3].
Deflationary Elements in Bitcoin
Deflation traditionally occurs when prices fall, increasing purchasing power. Bitcoin’s periodic sharp price corrections can be seen as transient deflationary phases, reflecting profit-taking, regulatory news impact, or technical sell-offs. For example, analysis pointing toward profit-taking and selling pressure despite new all-time highs indicates complex deflationary pressures within a generally bullish market environment[5].
Moreover, Bitcoin’s limited supply mechanism creates a built-in deflationary characteristic over time, as halvings reduce new supply issuances, gradually increasing scarcity and, theoretically, price appreciation.
Integrating the Pieces: Why Definitive Interpretation Is Challenging
Given the interplay of chart types, short- and long-term technical patterns, volume signals, and Bitcoin’s inherent characteristics, labeling a Bitcoin price chart as showing either “positive inflation” or “negative deflation” outright is problematic without extended context.
– A short-term uptick following low volume might be speculative, not genuine inflationary demand.
– A long-term uptrend backed by increasing institutional adoption and limited supply suggests inflationary forces where demand exerts upward pressure.
– Sudden price drops amid high volume might reflect deflationary corrections. Still, these can be part of healthy market cycles rather than sustained deflation.
Additionally, Bitcoin’s unique economic mechanics—capped supply, influence of crypto-specific events like options expiry, and nontraditional investor behavior—mean traditional inflation/deflation frameworks only partially apply.
Conclusion: Navigating the Bitcoin Inflation-Deflation Matrix
Interpreting Bitcoin price charts in terms of inflation or deflation requires nuanced understanding of market dynamics beyond headline price moves. Bitcoin combines scarcity-driven price increases with speculative volatility, making its price action a tapestry woven from both inflationary surges and deflationary corrections.
Investors and analysts must look beyond simplistic labels, considering chart patterns, trading volume, broader market sentiment, and macroeconomic signals. Bitcoin’s trajectory toward targets as high as $170,000 by 2026 suggests strong demand and digital scarcity effects akin to inflationary pressure. Still, corrections to levels near $101,000 reveal underlying deflationary adjustments typical in volatile markets.
Ultimately, Bitcoin’s price chart is a living document, reflecting a digital asset’s unique dance between inflation-like demand dynamics and deflation-like market corrections, a balance unlikely to be captured in one definitive snapshot but rather understood through ongoing observation and analysis.
—
References
[1] eToro Future Signals — Head & Shoulders pattern alert — https://twitter.com/eToro_Future/status/1651658685318121474
[2] Coblesweb3 — Descending triangle analysis — https://twitter.com/Coblesweb3/status/1651640103108514816
[3] Bitcoin BottomTop — Upside potential price targets — https://twitter.com/btc_bottom_top/status/1651664357337545473
[4] Ali Iqbal — Bitcoin surging forecast to $170k — https://twitter.com/aliiqballive/status/1651667336852635664
[5] CrypDroop — Glassnode analysis on selling pressure — https://twitter.com/CrypDroop_Intl/status/1651665636580066048
—
Further reading
– Bitcoin technical updates: https://twitter.com/btc_bottom_top
– Market sentiment and on-chain analysis: https://twitter.com/nodecharts
– Crypto pattern analysis: https://twitter.com/Sohailshah111