Decoding the Ethereum Bull Flag: A Deep Dive into Market Patterns and Price Predictions
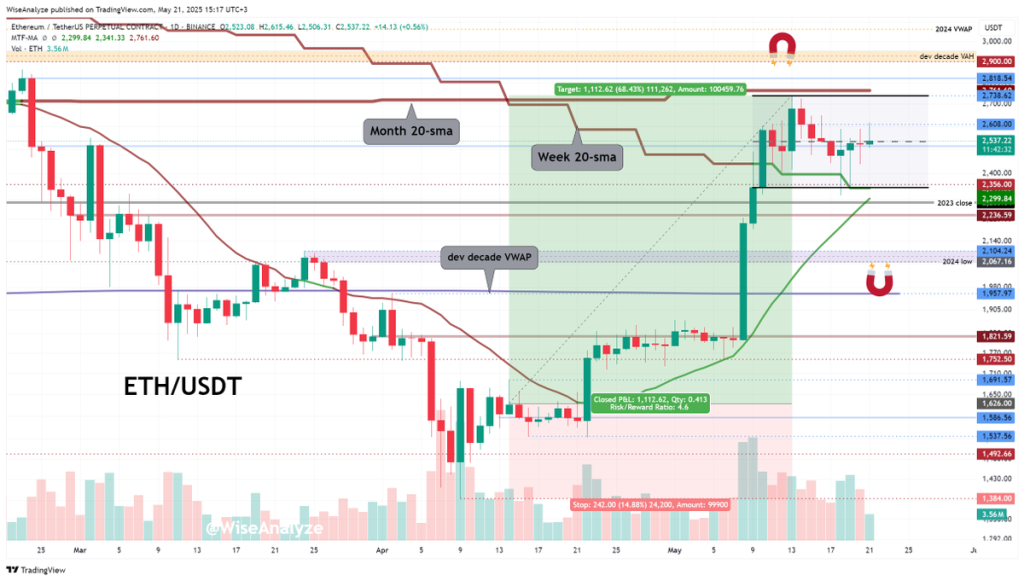
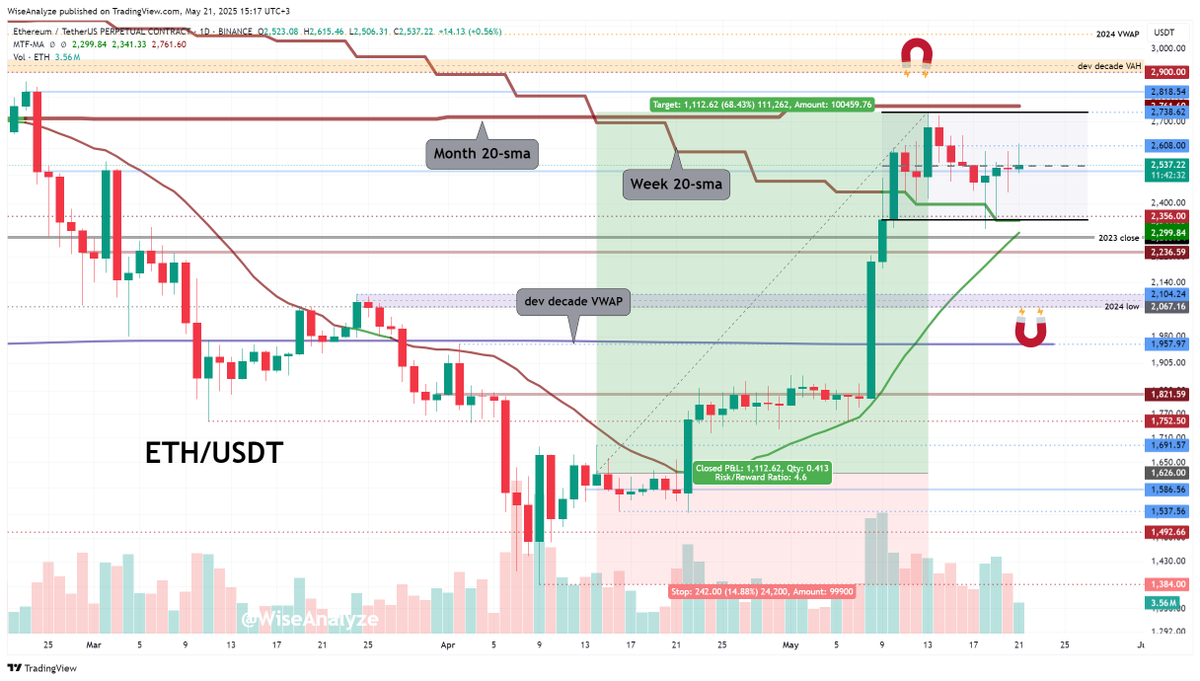
When it comes to interpreting cryptocurrency charts, a skillful blend of technical analysis and market intuition is essential. The recent tweet by Zen (@WiseAnalyze) makes a compelling case study with its mention of a “bull flag channel” for Ethereum, pinpointing prices between approximately 2356 and 2738. This price channel, complemented by the alignment with key moving averages, paints a vivid picture of where Ethereum might be headed in the near term.
Let’s unpack this analysis, understand the significance of the technical elements involved, and explore what this signals for Ethereum investors and observers.
Understanding the Bull Flag Channel in Ethereum’s Price Movement
The bull flag chart pattern is a classic technical indicator that suggests a potential continuation of an upward trend. Imagine a flagpole followed by a brief consolidation that slopes downward or sideways—a flag. This pattern usually emerges after a significant price rise, with the flag representing a momentary pause before the momentum resumes.
Zen’s mention of a bull flag channel between 2356 and 2738 means Ethereum’s price is fluctuating within this corridor, which acts as support (bottom) and resistance (top). This setup paints a picture of a market in balance but poised for a bigger directional movement.
– Bottom at 2356: Serving as a solid support level where buyers have previously stepped in.
– Top at 2738: Acting as resistance that the price has struggled to break above consistently.
This channel is vital because it confines the current price movements, limiting chaos and hinting at a pending breakout or breakdown.
The Role of Simple Moving Averages (SMA) in Market Context
Zen correlates the bull flag’s boundaries with the Monthly and Weekly Simple Moving Averages (SMA), which adds robustness to the analysis. SMAs smooth out price data to identify trends over specified periods and are frequently regarded as vital indicators for trend strength and direction.
– Monthly SMA: Reflects longer-term trend direction; if price stays above it, investors tend to consider the market bullish.
– Weekly SMA: Sheds light on intermediate-term sentiment.
The fact that the flag’s top and bottom roughly correlate with these moving averages suggests these levels are significant battlegrounds. It means investors and traders likely respect these boundaries framework-wise, making the area a logical place for collective decision-making.
Consequently, this alignment likely bolsters the strength of the identified support and resistance, meaning a break above or below these levels could signal a meaningful directional shift.
Current Positioning: A Price Poised at a Crossroads
Zen notes Ethereum’s price is currently in the middle of the flag channel, highlighting a scenario where either upward or downward movement is equally likely. This “equipoise” invites close attention:
– On the bullish side, a close above 2738 could trigger momentum, driving Ethereum to retest previous highs or potentially extend the bull run.
– On the bearish side, slipping below 2356 might signal a deeper retracement, possibly validating Zen’s longer-term target near 2100.
This midpoint situation is essentially a market tug-of-war, with buyers and sellers testing their resolve.
The Longer-Term Target: Revisiting Around 2100
The mention of a bullish retest near 2100 is intriguing. It implies that even within a bullish context, there is an acceptance that Ethereum’s price might temporarily step back to this level before resuming an uptrend.
This target likely draws from:
– Historical support/resistance levels around 2100, which have influenced price behavior previously.
– Moving average considerations, possibly where the 200-day SMA or other longer-term indicators reside.
– Psychological price action, where investors may recalibrate positions.
It’s a reminder that markets do not move upward in straight lines—corrections and retests are part of healthy, sustainable growth.
Navigating Next Steps: What Traders and Investors Should Watch
Given this setup, several key takeaways emerge for those following Ethereum’s price development:
Conclusion: Ethereum’s Bull Flag – On the Cusp of a Defining Move
Ethereum’s current formation within the bull flag channel between roughly 2356 and 2738 seems to epitomize a market in balance but fraught with anticipation. The confluence of this technical pattern with monthly and weekly moving averages suggests that the next move could be decisive—either escalating Ethereum’s gains or inviting a corrective phase.
Investors poised in this “middle zone” reflect the broader narrative of crypto trading: the dance between fear and greed, patience and impulse. Whether Ethereum breaks upward or dips to revisit 2100, this phase offers meaningful signals for both traders and long-term holders.
Tracking this formation in conjunction with real-time market data, volume, and broader crypto sentiment will be critical. For those who appreciate the artistry behind charting, this bull flag is more than lines on a graph—it’s a story unfolding in real time, revealing how human psychology and market mechanics interact.
—
Related Reading
– Investopedia: Bull Flag Pattern
– CoinDesk: How Moving Averages Can Guide Crypto Investors
– Ethereum Price Analysis & Predictions – CryptoNews
*These resources offer further insights into the technical concepts discussed above.*