Navigating the Waves of Bitcoin Analysis: Insights and Interpretations from May 2025
Bitcoin, often described as the digital gold of the 21st century, continues to captivate global investors, traders, and analysts alike. The landscape around May 19, 2025, is marked by bullish optimism intertwined with cautionary signals, reflecting the complex and multifaceted nature of crypto market behavior. This report delves into the latest analyses, technical indicators, community sentiments, and emerging patterns influencing Bitcoin’s trajectory toward potential new all-time highs.
—
The Bullish Pulse: Predictions Beyond $110K
Several analysts and influential commentators suggest Bitcoin is on the cusp of surpassing its previous records, with fractal analysis pointing to a potential rally above $110,000 by the end of the week. This bullish anticipation is underscored by:
– Fractal Patterns: Specialized charts used by @ftf_vc and others indicate replicable price behaviors that have historically been precursors to strong upward moves.
– Momentum Indicators: Positive Ichimoku Cloud signals and weekly momentum megatrends highlighted in commentary by Kerry Prince reflect a broader level of market confidence in Bitcoin’s upward momentum.
– Accumulation Trends: On-chain data from Glassnode reveals most Bitcoin holders, including those controlling 1-10 BTC, are net buyers, a sign of broad-based conviction rather than speculative flipping.
This convergence of technical and behavioral factors fuels enthusiasm among traders and positions Bitcoin for a fresh surge potentially eclipsing prior milestones.
—
The Bearish Contrasts: Indicators Raising Caution
Despite the optimism, a prudent outlook requires acknowledging nuanced bearish signals and mixed technical readings:
– Bearish Divergence: Some analyses reveal divergence between price movements and momentum oscillators, which often signal weakening strength in the rally. An example is the Aroon indicator exhibiting a “92/100 bearish cross,” highlighting strong but frustrating bearish trends.
– Resistance Boundaries: The Ichimoku Cloud, while sometimes turning bullish, also currently acts as a formidable resistance barrier, creating a friction zone where the price must prove its strength.
– Volatility and Pullbacks: The recent pullback from $107,115 to near $102,554, a 4.3% decrease, suggests heightened volatility which could unsettle less risk-tolerant traders.
– Uncertain Confidence Metrics: Tools like JudyBotSignals suggest a bearish sentiment with a confidence level near 49%, reflecting market indecision and the necessity for vigilant trend confirmation.
Such cautionary flags serve as reminders that Bitcoin’s ascent is neither guaranteed nor linear; the path to new highs is fraught with potential headwinds.
—
Patterns and Price Structures: Decoding Market Geometry
To understand the psyche of the market beyond simple price action, we look to chart patterns and advanced technical formations:
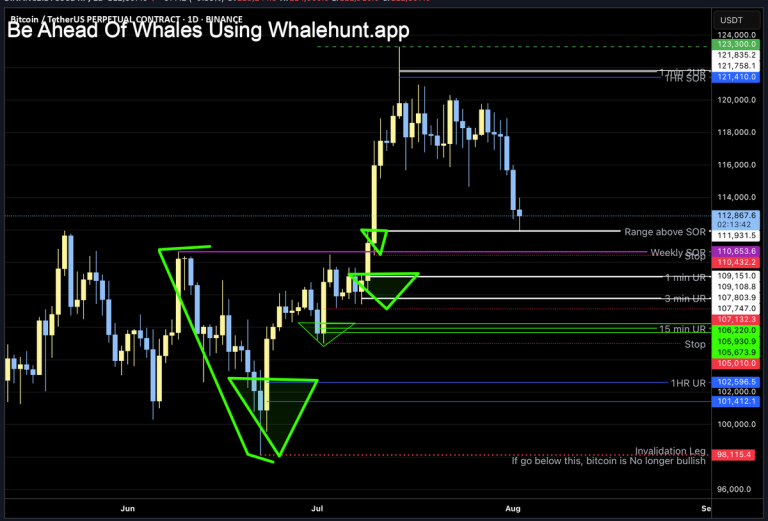
– Descending Broadening Wedge: Bitcoin’s pattern within a descending broadening wedge hints at consolidation with volatility expansion, often preceding a breakout. The price trades just below resistance trendlines, indicating tension between bulls and bears.
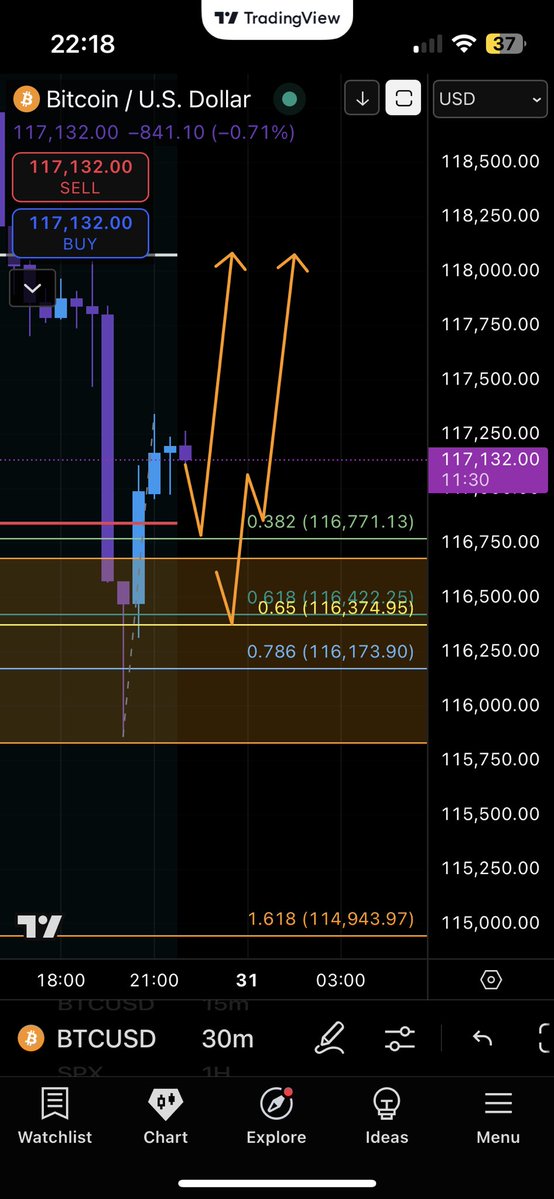
– Horizontal Support and Liquidity Taps: The consolidation phase suggests that key horizontal supports are tested and respected, which can provide a launchpad for renewed upward momentum.
– Swing High and Low Dynamics: Some analysts highlight failed attempts to break swing highs, signaling potential for sharp corrections down to previous swing lows (~$3,000 in some interpretations, though such a move may be an outlier or hyperbolic warning).
These patterns, which combine geometry with market psychology, offer traders frameworks to gauge potential breakout points and risk zones.
—
Leveraging Technology: AI and Data-Driven Trading
The new era of crypto trading increasingly incorporates artificial intelligence and quantitative analysis:
– AI-Powered Sentiment and Trend Forecasts: Platforms like ScorehoodAI advocate substituting emotional, blind trading with algorithm-driven predictions, enhancing decision accuracy amid crypto’s notorious volatility.
– Genetic Algorithms and Machine Learning: Advanced tools analyze genetic AI models to predict liquidation points, bounce probabilities, and trend reversals, empowering traders with data-backed foresight.
– Trade Journals for Discipline: As advocated by Victoria Hithernann Michelle, meticulous record-keeping of trades, setups, and emotional states enhances traders’ ability to refine strategies and avoid repeating errors.
This technological infusion represents a maturation in trading philosophy—moving from gut feelings to structured, empirically supported decision-making.
—
The Broader Ecosystem: Altcoins and Market Sentiment
Bitcoin’s fate influences, and is influenced by, the broader crypto environment:
– Altseason Signals: Elliott Wave projections discussed in upcoming webinars predict not only Bitcoin’s journey to $200K but also the triggering of an altseason—where altcoins might rally strongly, buoyed by Bitcoin’s performance.
– Polygon and Other Major Altcoins: Critical voices suggest potential dumps in tokens like MATIC and POL, which could impact sentiment and liquidity flows between Bitcoin and alt sectors.
– DeFi and Testnet Developments: Initiatives like the Fiamma Testnet related to Bitcoin point to ongoing ecosystem development that could influence network effects and future adoption, indirectly affecting Bitcoin value.
Understanding the interplay between Bitcoin and altcoins offers a holistic view, as money often rotates within the crypto market, affecting supply and demand dynamics.
—
Emotional and Psychological Landscape
The intense fluctuations evoke a range of trader emotions—from excitement and bullishness to frustration and caution:
– Risk Management Insights: Experienced traders emphasize the need to “take profit quick” and avoid stubbornly holding losing positions, reflecting lessons learned from Bitcoin’s volatility.
– Active Community Dialogue: Social media platforms show varied opinions, from confident bullish calls to skeptical technical assessments, creating a dynamic, real-time sentiment gauge.
– Market Noise vs. Signal: The volume of mixed signals requires traders and investors to cultivate discernment, balancing hype with grounded analysis.
This psychological dimension is as critical as numeric trends because markets ultimately move on collective human behavior.
—
Conclusion: Bitcoin’s Journey is a Complex Dance Between Bullish Potential and Bearish Realities
As Bitcoin hovers around the $100K-$110K range in May 2025, it exemplifies a market at a crossroads. On one hand, technical tools, fractal patterns, and accumulation behaviors point toward possible new highs, energizing bulls and creating FOMO among traders. On the other, resistance zones, bearish divergences, and uncertain signals counsel caution, reminding market participants that volatility remains high and reversals are not improbable.
This narrative underlines the importance of layered analysis—employing technical, on-chain, sentiment, and AI-driven data—to navigate Bitcoin’s unpredictable dance. For traders, investors, and observers, the message is clear: success will favor those who acknowledge the complexity, adapt swiftly, and manage risks with discipline.
Whether Bitcoin achieves new historic peaks soon or consolidates further before its next ascent, one truth stands firm: the digital asset’s story is continuously unfolding, challenging and inspiring simultaneous curiosity and prudence in equal measure.
—
References and Further Reading
– Glassnode On-Chain Analysis
– Elliott Wave Forecast Official Site
– Kerry Prince Twitter – Crypto Analysis
– Scorehood AI Trading App
– NeonBlazee1’s Bitcoin Analysis
– JudyBotSignals Crypto Sentiment
—
This comprehensive synthesis captures the vibrant, often contradictory world of Bitcoin analysis seen in May 2025, offering readers a clear viewpoint without oversimplifying or glossing over the market’s inherent uncertainties.