Analyzing Bitcoin’s Current Market Dynamics: A Deep Dive into the Latest Technical and Fundamental Indicators
—
Bitcoin, the flagship cryptocurrency, continues to be the focal point of traders and analysts alike as it navigates turbulent market waters. Recent price movements, mixed signals from key technical indicators, and broader macroeconomic influences make this an intriguing moment to dissect BTC’s current behavior and potential trajectory. This report unpacks these complex factors in accessible terms and provides a layered understanding of what lies ahead for Bitcoin.
Rebounding from Support: The Battle at the Trendline
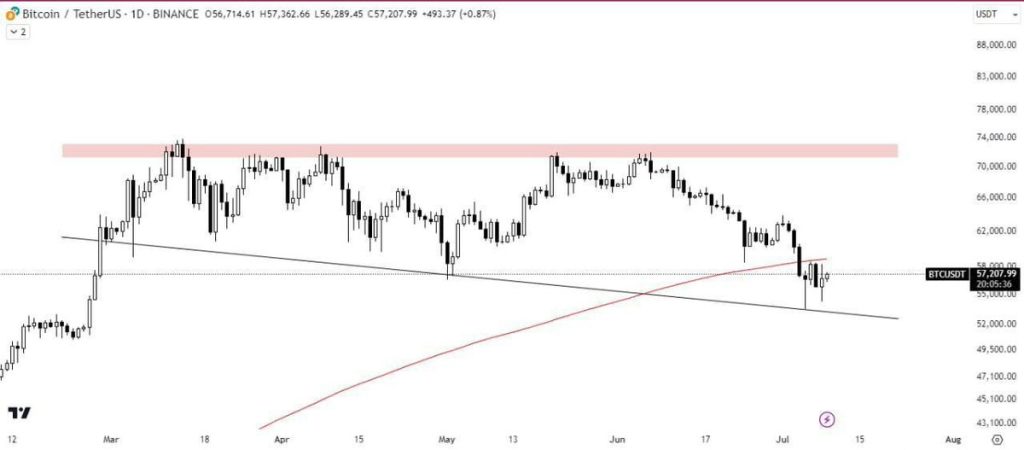
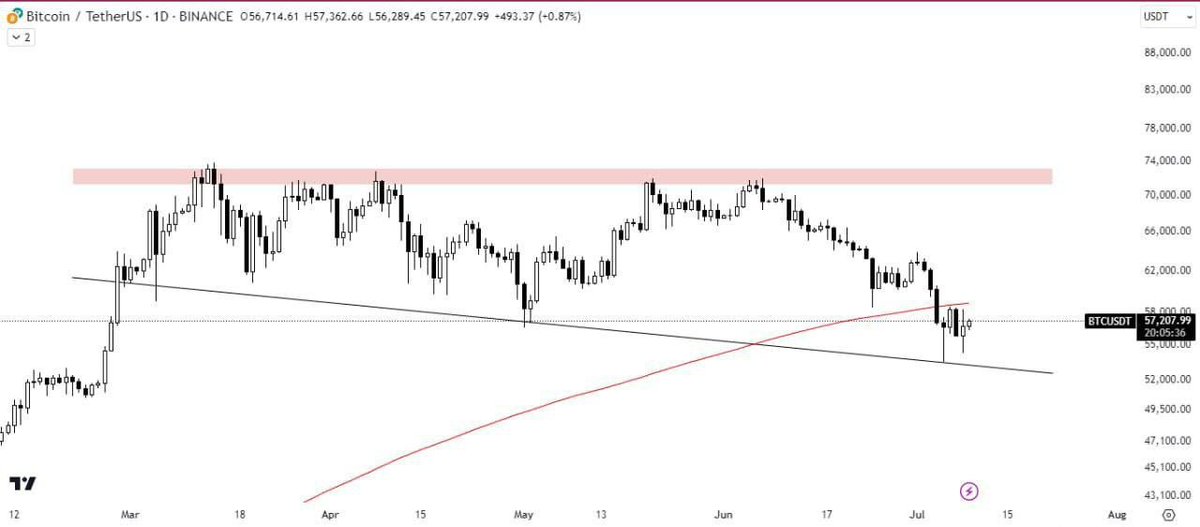
Bitcoin’s recent price action shows a significant rebound from a support trendline after rejection at a horizontal supply zone. This suggests that while sellers attempted to push prices down, buyers quickly entered to defend this critical level, which acted like a safety net. From a technical standpoint, the *support trendline* represents a diagonal level where demand historically outpaces supply, providing a floor to the price.
However, above the current price, the 200-day moving average (200MA) is acting as a resistance barrier. The 200MA is a widely followed indicator reflecting the average closing price over 200 days, serving as a key psychological and technical hurdle. Traders often interpret resistance at this level as potential selling pressure or hesitation among bulls to push prices higher aggressively.
The interplay between this rebound and resistance forms a narrative of consolidation — Bitcoin is caught between defending its current levels and breaking through longer-term resistance. The critical question for market participants is whether Bitcoin can muster the momentum to break the 200MA and continue a bullish run or if it will face rejection and a deeper pullback.
Chart Patterns Telling the Story: Symmetrical and Ascending Triangles
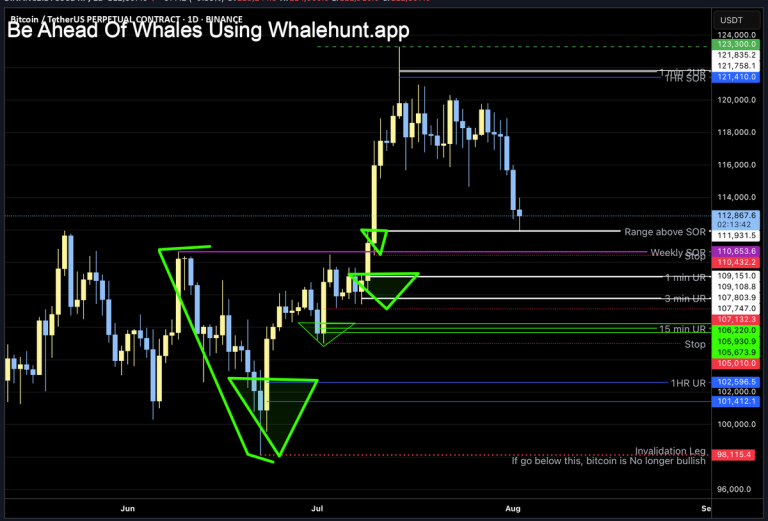
Chart patterns provide a visual language for traders to predict possible market directions. Recently, Bitcoin broke down from a *symmetrical triangle* pattern, a shape composed of converging trendlines that typically predicts a breakout in either direction. Such a breakdown historically signals bearish pressure, but Bitcoin’s subsequent trading above a strong horizontal demand zone tempers outright pessimism.
Further boosting bullish sentiment is Bitcoin’s breakout from an *ascending triangle* pattern—a formation characterized by a horizontal resistance line paired with an upward sloping support line. The breakout accompanied by strong volume gives weight to a potential sustained upward move.
Moreover, the presence of the *Ichimoku cloud* providing support emphasizes that Bitcoin’s current momentum has multifaceted backing. The Ichimoku indicator, a comprehensive tool combining several technical metrics, helps identify support and resistance zones, momentum, and trend direction. Support from this cloud aligns with the ascending triangle breakout, hinting at underlying strength.
Momentum Indicators and Volume: Reading the Market’s Pulse
Volume spikes during a breakout or breakdown confirm the conviction behind the price move; low volume breaks might result in false signals. Bitcoin’s reported breakouts from key patterns have been underscored by robust volume, lending credibility to these moves. Additionally, momentum oscillators like the Relative Strength Index (RSI) hover just below overbought territory, which suggests Bitcoin retains room to appreciate before hitting potential exhaustion zones.
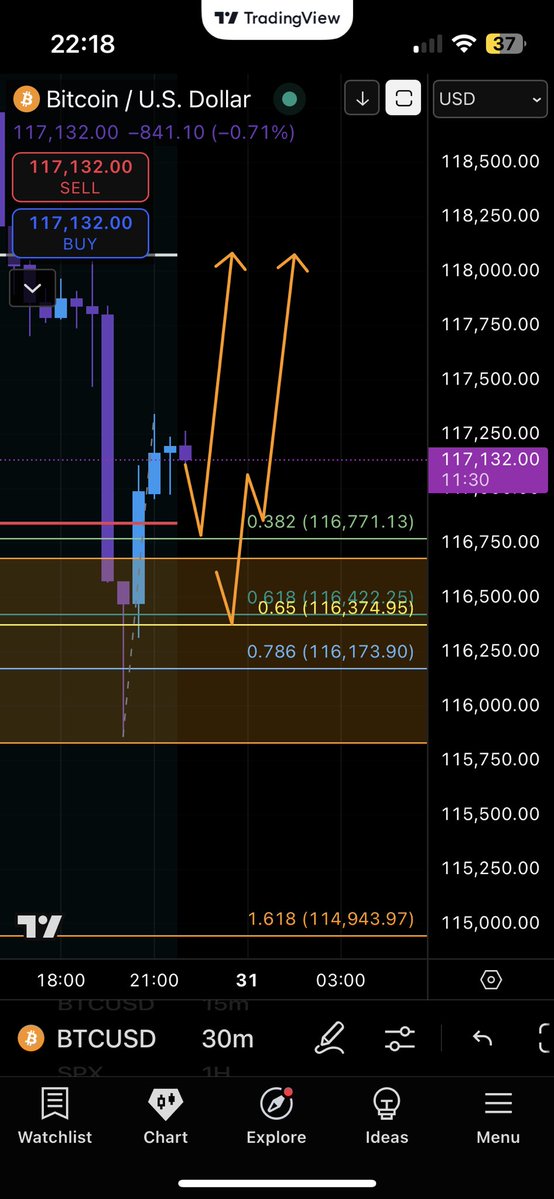
Short-term consolidation around significant price levels, such as the $104,000 to $105,860 range, marks a phase of market indecision. This pause can either be a launching pad for higher gains or a setup for retracement. Traders watch this range closely: a decisive break above signals bullish continuation, while failure may indicate a retracement to lower support zones like the recently tested $102,500 level.
Institutional Influence and Market Sentiment
Behind the technicals lies a crucial fundamental driver: institutional investment and macroeconomic money supply conditions. Notably, the latest Commitment of Traders (COT) reports highlight increased institutional long positions in Bitcoin, indicating growing professional confidence in the asset’s appreciation potential.
This institutional momentum is buttressed by broader macroeconomic trends, such as the global M2 money supply growth. An expanding money supply often correlates with asset inflation, which in turn supports higher valuations for scarce assets like Bitcoin. Market participants interpreting these signals see the groundwork for a bullish phase that could propel Bitcoin toward new all-time highs.
Risks and Warning Signals: Volatility and Potential Pullbacks
Despite the bullish undertones, volatility remains an ever-present companion of Bitcoin trading. Analysts caution that a possible dip toward $90,000 could materialize, stemming from market corrections or profit-taking after the recent rally. This warning underscores that even amid strong structural support, markets can be unpredictable and susceptible to sharp moves driven by sentiment shifts or external shocks.
The concept of *liquidations*—forced sales of leveraged positions—also adds to the risk matrix. Sudden price moves can trigger cascading liquidations, intensifying volatility in short periods. Observing liquidation levels and open interest helps traders gauge market stress and adjust strategies accordingly.
The Role of AI and Advanced Data Analysis in Trading
In this evolving scenario, the adoption of advanced tools, including AI-driven trading platforms like Scorehood, suggests a gradual shift from emotion-based to data-driven trading approaches. These tools analyze vast datasets to identify continuation patterns and liquidation levels, aiming to improve decision-making and profitability.
AI assists in decoding complex interactions between indicators such as trade volume, momentum, moving averages, and order flow to generate actionable insights. However, despite technological advances, the unpredictable human element and black swan events keep markets inherently uncertain.
—
Conclusion: Navigating Bitcoin’s Crossroads with Insight and Prudence
Bitcoin currently stands at a crossroads forged by competing forces. On one side, solid support trendlines, ascending triangle breakouts, and institutional interest suggest the foundation for a strong bullish phase. On the other, significant resistance levels like the 200MA, symmetrical triangle breakdowns, and looming volatility risks signal caution.
For investors and traders, this juncture underscores a critical duality: the opportunity for significant upside balanced against the risk of sharp pullbacks. Careful monitoring of chart patterns, volume dynamics, momentum indicators, and macroeconomic data provides the best pathway to informed decision-making.
In essence, the Bitcoin market is not simply moving along a line but is engaged in a dynamic dance influenced by technical, fundamental, and psychological factors. Appreciating these layers and their interplay allows market participants to better anticipate Bitcoin’s next moves, crafting strategies that embrace both opportunity and risk.
—
Sources
– Dynamic Trade Calls (@Ben_smithscott5) — Bitcoin chart pattern insights and 200MA resistance analysis (Twitter)
– Rohan (@rohan_nyx) — Institutional positioning and Elliott Wave analysis on Bitcoin (Twitter)
– CryptoRobotics daily analysis updates (Twitter)
– Scorehood AI trading tool overview and application in crypto markets (scorehood.com)
– Infomediarius — Market volatility and potential Bitcoin dips (Twitter)
Dynamic Trade Calls
Rohan’s Market Insights
CryptoRobotics Analysis
Scorehood AI
Infomediarius Bitcoin Speculation