Bitcoin’s market pulse in mid-May 2025 paints a picture rich with potential and caution. As one of the most discussed and traded cryptocurrencies, the coin’s price movement, technical patterns, and market sentiments weave a fascinating narrative that demands unpacking. Below is a detailed analysis that dissects recent data points, trading signals, and market psychology surrounding Bitcoin (BTC), offering a comprehensive view on its direction and implications for investors and crypto enthusiasts.
Setting the Stage: Bitcoin’s Current Market Context
In the early hours of May 16, 2025 (02:00 AM IST), Bitcoin hovered near a critical price point, with real-time updates suggesting an imminent breakout. The coin was consolidating just below a previous all-time high (ATH) of $110,000 after having reclaimed the psychologically important $100,000 threshold. Such consolidation after reclaiming a significant support often signals preparation for the next move, either a bullish surge or a bearish retracement. Market commentators highlighted the “future of money is digital,” reinforcing the long-term transformative narrative[1].
However, volume patterns told a nuanced story. While some observers expressed optimism about a bull run, others noticed a lack of strong buy-side volume, instead identifying liquidity grabs below key levels. This indicates a cautious market where institutional players might be engaging in partial profit-taking or positioning for volatility ahead[2].
Dissecting Technical Indicators and Chart Patterns
1. Weekly and Short-Term Chart Observations
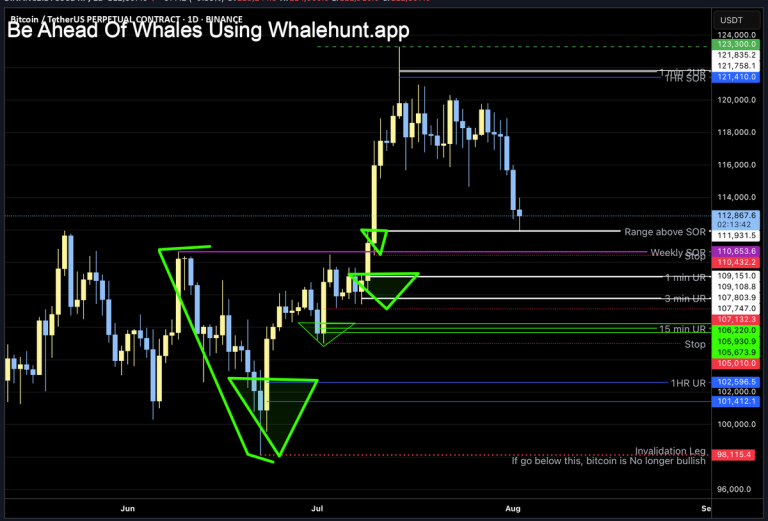
On the weekly chart, Bitcoin’s price action lacked robust upward momentum. Liquidity grabs — sharp dips under support levels to trigger stops before bouncing — were observed. This pattern implies market-makers might be testing liquidity depth, a common prelude to sustained moves, yet also a warning against prematurely declaring a bull run[2].
Short-term charts, such as the 4-hour timeframe, showed Bitcoin trading inside a symmetrical triangle pattern, a classic consolidation shape signaling price equilibrium between bulls and bears. Support provided by the Ichimoku cloud further buttressed this consolidation, offering a technical floor for price declines. Anticipation centered around a bounce from the triangle’s support trendline, which would favor an upside breakout[3].
Further short-term considerations suggested a probable temporary pullback toward the $95,000–$97,000 zone. Analysts framed this as a healthy correction phase before a renewed advance, encouraging traders to watch specific zones for potential long entries[4].
2. Support and Resistance Levels
Strong support levels were identified near $95,274, believed to be a critical line that Bitcoin would unlikely breach in the current cycle[5]. The upside resistance cluster, especially at the $103,000–$106,000 mark, posed challenges. This was described as a “supply zone” or distribution area where selling pressure accumulated. The formation of a “Weak High” at this zone hints at potential liquidity grabs aimed at stop hunters and traders chasing breakouts, a familiar hallmark of volatile Bitcoin moves[6].
3. Market Liquidity and Liquidation Risks
A market snapshot revealed that a 10% price rally could trigger about $8 billion in liquidations, while a 10% drop might trigger $4 billion. This asymmetry signals an “upside liquidation magnet,” where market dynamics may predispose Bitcoin to a rapid bullish swing as short positions get squeezed[7]. However, the risk of a downturn remains given the substantial liquidation volume on both sides.
4. Other Indicators and Observations
Some trading voices incorporated unconventional indicators like astrology and Allen Fibonacci retracements. For instance, breaking multiple moving averages with volume and losing a mid-week price level on the one-hour timeframe reflected layered technical pressure and potential bearishness in the very short term[8].
The Broader Crypto Market Sentiment
Bitcoin rarely moves in isolation. Daily market snapshots indicated marginal price shifts among top coins: Ethereum slightly declined, Tether remained stable, XRP and BNB faced mild downturns, while Bitcoin’s tiny upward move underscored relative stability in an otherwise volatile environment[9].
Risk appetite seemed somewhat muted, with volume signatures and premiums suggesting traders were keen to lock in profits but wary of committing fully ahead of clearer signals[10]. The market was described as in a “post-reclaim consolidation,” a state ripe with both opportunity and risk.
Community and Expert Takeaways
Two widely varied perspectives emerged around Bitcoin’s near-term trajectory. Optimists pointed to technical setups favoring breakouts and healthy corrections as a precursor to renewed bull runs. They also highlight Bitcoin’s resilience at key support levels and the significance of holding the $100K mark as a base for growth[1][4].
Conversely, some experts forecasted an impending decline, possibly to near $95,607, indicating a retest of lower supports before any significant recovery[11]. This tug-of-war reflects Bitcoin’s competitive battle between accumulation by smart money and profit-taking by leveraged positions.
Implications for Investors and Traders
For those navigating Bitcoin’s choppy waters now, a few clear strategies emerge:
– Patience in Confirmation: Given the consolidation patterns, waiting for decisive breakout above the $110K level or breakdown below $95K is prudent to minimize false signals.
– Monitoring Volume and Liquidity Zones: Pay close attention to buy-side volume spikes and liquidity grabs; these often presage stronger trend moves.
– Risk Management Around Liquidations: High liquidation potential means traders should size positions carefully to avoid amplified losses during volatility.
– Utilize Multiple Timeframes: Analyze weekly, daily, and intraday charts collectively. The bigger picture smooths out noise and lends clarity to short-term moves.
Conclusion: The Crucial Crossroads for Bitcoin
Bitcoin in May 2025 sits at a fascinating crossroads. The general market oscillates between optimism fueled by digital currency’s long-term promise and caution shaped by technical and liquidity complexities. While the coin consolidates below a key resistance level, signs point to a potential breakout, yet equally, a retreat toward support levels is on the table.
This phase is less about extremes and more about balance—market forces wrestling for dominance before the next directional trend asserts itself. Investors and traders face a landscape that demands keen observation, measured risk-taking, and openness to adapt as the chart patterns unfold.
In essence, Bitcoin embodies its role as the vanguard of digital finance—poised to breakthrough traditional financial boundaries, yet subject to the relentless dynamics of supply, demand, and human psychology. Navigating this moment with a blend of technical insight and market awareness could position participants well for the next chapter in cryptocurrency’s evolving story.
—
Sources
Recommended Reading
– Bitcoin Weekly Chart Analysis on Crypto Psycho
– Market Liquidation Insights by PrimeX BTC
– Ichimoku Cloud and Symmetrical Triangle Pattern Overview
– BTC Price Update and Consolidation
—
If you want to explore further or discuss specific Bitcoin trade setups or broader cryptocurrency strategies, I’d be happy to continue the conversation. The crypto terrain remains thrilling and complex, with every day offering fresh data points and market signals.
—
Dive into Bitcoin’s next move with clear, jargon-free analysis and smart strategies—stay ahead, informed, and ready to act!