The Art of Precision in Harmonic Patterns: A Deep Dive into the Butterfly Pattern
Imagine standing at the edge of a vast ocean, watching waves crash against the shore. Each wave is unique, yet they all follow a rhythm, a pattern. In the world of trading, harmonic patterns are like these waves—unique yet predictable. Among these patterns, the Butterfly pattern stands out for its precision and potential for significant price movements. Let’s dive in and explore the intricacies of the Butterfly pattern, its applications, and its power in the world of trading.
Understanding Harmonic Patterns
Harmonic patterns are geometric price structures that traders use to identify potential reversal points in the market. These patterns are based on Fibonacci numbers and ratios, which are ubiquitous in nature and finance. The most common harmonic patterns include the Gartley, Butterfly, Bat, and Crab patterns. Each pattern has its unique structure and implications, but they all share the goal of identifying high-probability reversal zones.
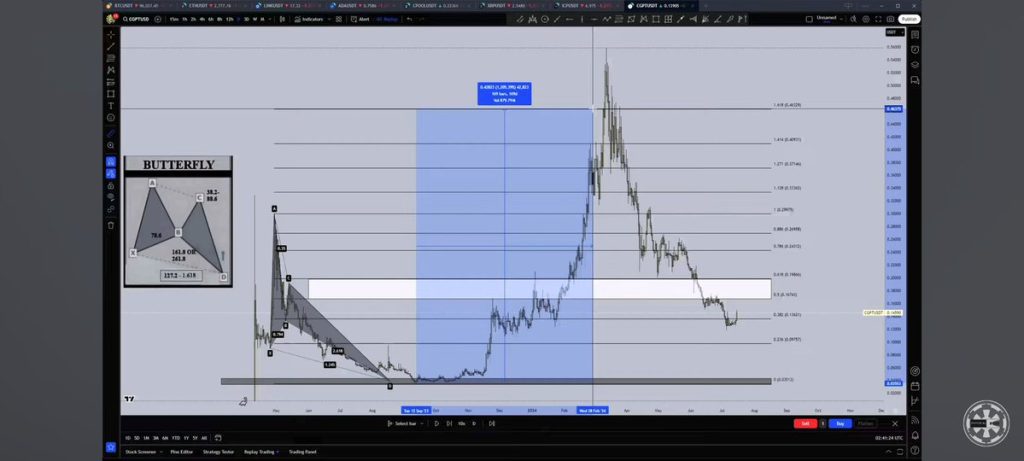
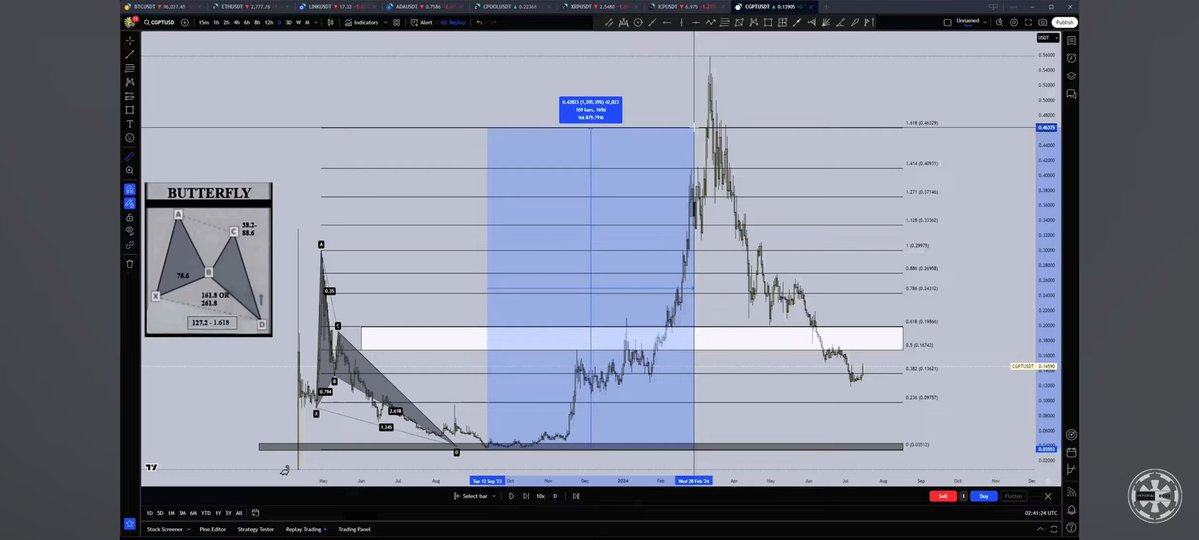
The Butterfly pattern, in particular, is known for its precision and the potential for significant price movements. It consists of five points, labeled X, A, B, C, and D. The pattern is complete when point D reaches a specific Fibonacci extension level from point X.
The Anatomy of the Butterfly Pattern
To understand the Butterfly pattern, let’s break down its structure:
– Point X: The starting point of the pattern.
– Point A: The first significant price movement from X, typically a 78.6% Fibonacci retracement.
– Point B: A retracement from A, usually around 38.2% to 88.6% of the XA leg.
– Point C: A continuation from B, often extending 127% to 161.8% of the AB leg.
– Point D: The final point, which completes the pattern. It is a 127% to 161.8% extension of the XA leg and a 161.8% to 261.8% extension of the BC leg.
The Butterfly pattern is considered complete when point D reaches the specified Fibonacci extension levels. This completion often signals a potential reversal in the market.
The Power of the Butterfly Pattern
The Butterfly pattern is renowned for its precision and the potential for significant price movements. Traders often use this pattern to identify high-probability reversal zones, allowing them to enter trades with a favorable risk-reward ratio. The pattern’s reliability stems from its adherence to Fibonacci ratios, which are deeply rooted in financial markets.
One of the key advantages of the Butterfly pattern is its ability to provide clear entry and exit points. By identifying the completion of the pattern at point D, traders can set precise stop-loss and take-profit levels, enhancing their trading strategy’s effectiveness.
Applying the Butterfly Pattern in Trading
To apply the Butterfly pattern in trading, follow these steps:
Case Study: The Butterfly Pattern in Action
Let’s consider a real-world example of the Butterfly pattern in action. In a recent analysis, a trader identified a bullish Butterfly pattern on the Bitcoin chart. The pattern’s completion at point D signaled a potential reversal, and the trader entered a long position. The trade resulted in a significant price movement, with Bitcoin’s price increasing by over 1000% from the pattern’s completion point. This example highlights the pattern’s precision and potential for substantial gains.
The Future of Harmonic Patterns
As the world of trading continues to evolve, harmonic patterns like the Butterfly will remain valuable tools for traders. Their adherence to Fibonacci ratios and geometric structures provides a reliable framework for identifying market reversals. With advancements in technology and data analysis, traders can expect even more precise and effective applications of harmonic patterns in the future.
Conclusion: Embracing the Power of Precision
The Butterfly pattern is a testament to the power of precision in trading. By understanding its structure and applying it effectively, traders can identify high-probability reversal zones and capitalize on significant price movements. As we continue to explore the depths of harmonic patterns, let us embrace the precision they offer and use it to navigate the ever-changing landscape of financial markets.