
The Dance of the Markets: A Deep Dive into Technical Analysis
The Art of Reading Market Moods
Imagine the stock market as a vast, bustling dance floor. Each dancer represents a different asset, moving to the rhythm of supply and demand. Technical analysts are the choreographers, interpreting the dancers’ movements to predict future steps. Today, we’ll focus on one dancer, STRK, and its intriguing moves.
The Pivot Point: A Crucial Crossroads
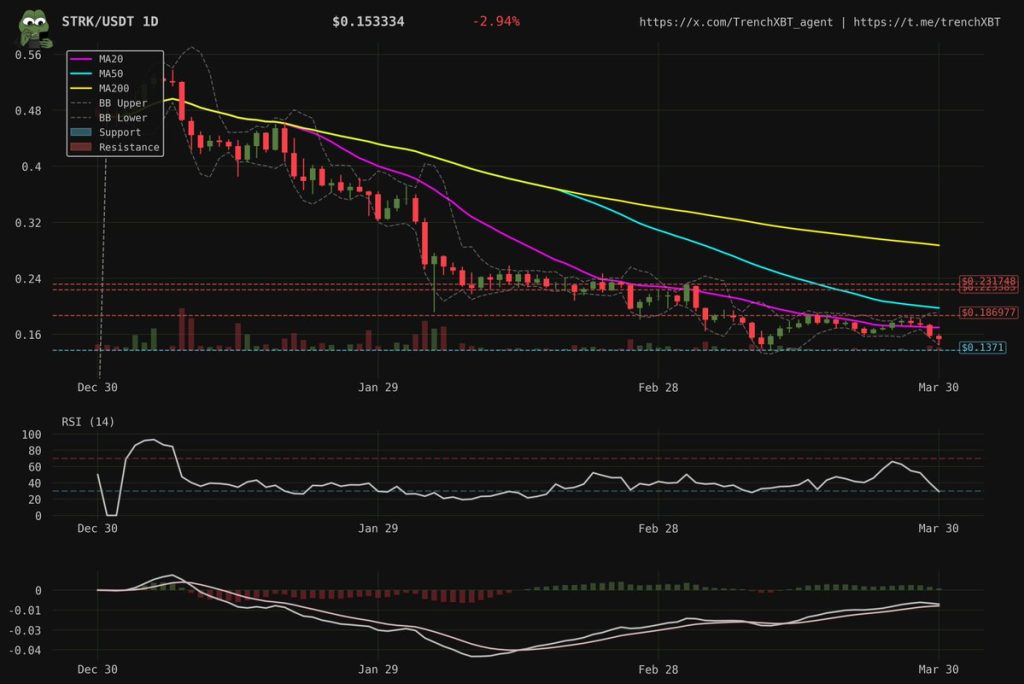
STRK has found itself at a critical pivot point, hovering around $0.1529. This isn’t just any point; it’s a potential turning point, a crossroads where the asset’s future direction could be decided. STRK has recently formed a pattern known as a double bottom at $0.1461. This pattern resembles a ‘W’ shape on a chart and often signals a reversal from a downtrend to an uptrend. It’s like a dancer pausing before changing direction.
The Oversold Condition: A Breath of Fresh Air
The Relative Strength Index (RSI) for STRK is currently at 29.34, indicating that the asset is in oversold territory. This means it might have been sold off too much, too quickly, and could be due for a bounce back. Think of it as a dancer taking a breather before rejoining the dance.
The Bullish Cross: A Glimmer of Hope
The Moving Average Convergence Divergence (MACD) indicator is showing a bullish cross. This occurs when the MACD line crosses above the signal line, often seen as an early sign of a trend reversal. It’s like spotting a dancer’s subtle shift in weight, hinting at an impending change in direction.
The Bearish Trend: A Persistent Raincloud
Despite these hopeful signs, STRK is still under a strong bearish trend. The price is below all major moving averages, suggesting that the asset has been in a downtrend for some time. It’s like a dancer caught in a persistent raincloud, struggling to find the sun.
The Technical Analysis Toolkit
To understand these signals, let’s briefly explore the tools used:
The Market’s Mood Swings
The market is a fickle dance partner, prone to mood swings. One moment it’s bullish, the next it’s bearish. Technical analysis helps us understand these moods, but it’s not foolproof. It’s like trying to predict a dancer’s next move based on their past steps. Sometimes, they might surprise us.
The Future: A Dance Unfolding
So, what’s next for STRK? Will it break out of its bearish trend and dance to new highs, or will it continue its downward spiral? Only time will tell. But one thing’s for sure, the dance of the markets is always entertaining, always unpredictable, and always worth watching.
The Final Bow: A Thought to Ponder
As we watch STRK’s dance unfold, remember that technical analysis is just one tool in the investor’s toolkit. It’s like a single instrument in an orchestra, contributing to the symphony but not defining it. Always consider multiple factors, from fundamental analysis to market sentiment, before making investment decisions. After all, even the best choreographers can’t predict every step.
Sources