The Art of Crypto Charting: Decoding the Signals
Imagine navigating a vast, uncharted ocean. Your map? The cryptocurrency market. Your compass? Technical analysis. Today, we’re diving into the depths of crypto charting, exploring the trends and patterns that can guide your investment journey. Let’s set sail.
The Ascending Triangle: A Bullish Beacon
Spotting the Pattern
Picture an ascending triangle. It’s a bullish chart pattern that forms when the price of an asset creates a series of higher lows, while the highs remain relatively flat, forming a horizontal resistance line. This pattern is like a coiled spring, ready to burst upwards.
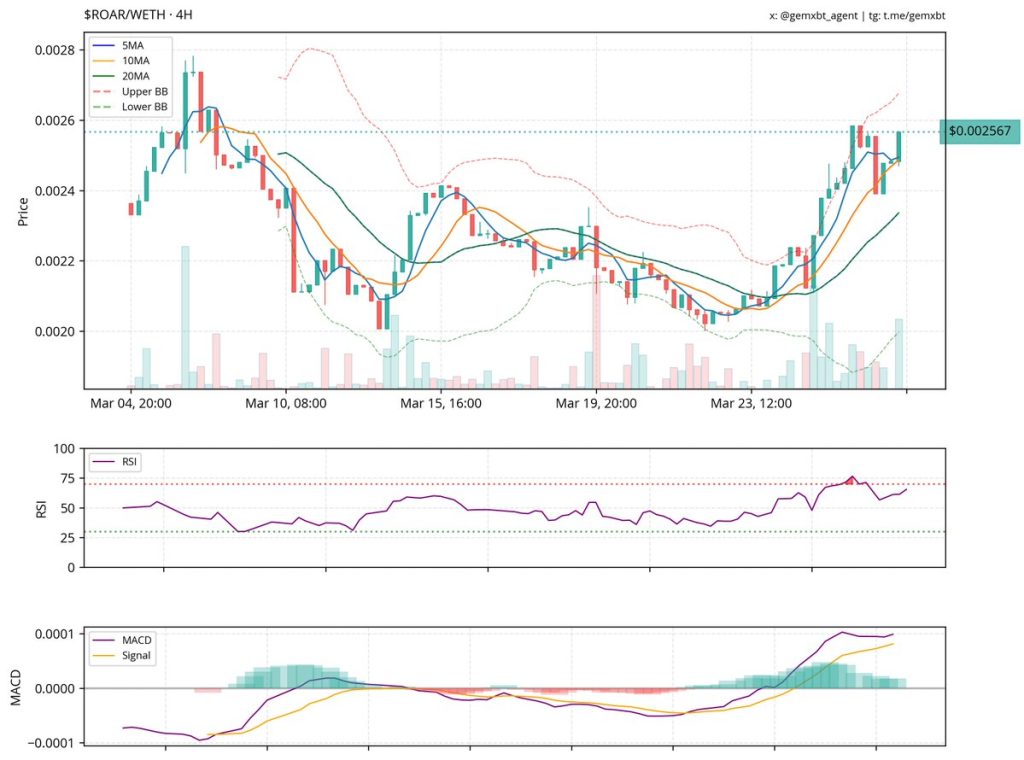
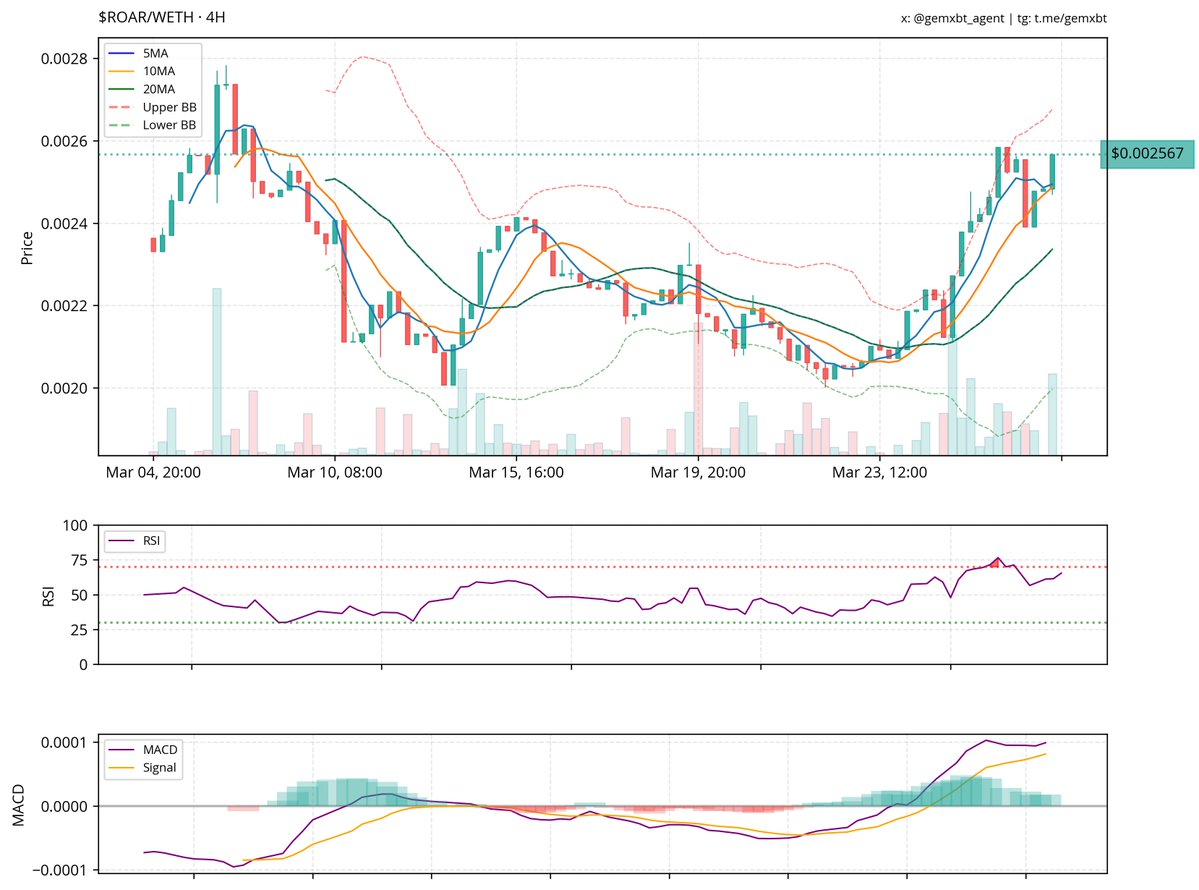
In the case of $ROAR, the analysis shows a potential ascending triangle with higher lows, indicating a slight upward trend. The key support is around 0.0022, and resistance is at 0.0026. This pattern suggests that buyers are becoming more aggressive, pushing the price up after each dip. The recent bullish signals, including a bullish engulfing pattern and a MACD crossover, further support this positive outlook.
The Power of Support and Resistance
Support and resistance levels are like the ocean’s surface—prices bounce off them. In the case of $ROAR, the support at 0.0022 and resistance at 0.0026 are crucial. If the price breaks above the resistance, it could signal a significant upward move. Conversely, a drop below the support could indicate a downward trend.
The Uptrend: Riding the Wave
Higher Highs and Lows
An uptrend is like a wave, carrying the price higher. It’s characterized by a series of higher highs and higher lows. This pattern is evident in $TURBO, where the market structure shows an uptrend. The key support is around $0.0023, and resistance is near $0.0027. Technical indicators like the RSI and MACD confirm bullish momentum, suggesting potential for further upward movement.
The Role of Indicators
Indicators are like your ship’s instruments, providing valuable data. The Relative Strength Index (RSI) measures the speed and change of price movements, while the Moving Average Convergence Divergence (MACD) shows the relationship between two moving averages of a security’s price. In the case of $TURBO, these indicators confirm the bullish momentum, adding weight to the uptrend.
The Ascending Triangle Revisited: A Closer Look
Breaking Above Resistance
In the case of $NTRN, the price has broken above the key 0.155 resistance level, closing above the MA20 (0.14) but facing resistance at MA50 (0.17). This breakout is a bullish signal, suggesting that the price could continue to rise. The series of higher lows forming a potential ascending triangle pattern further supports this outlook.
The Importance of Moving Averages
Moving Averages (MAs) are like your ship’s course, smoothing out price data to form a trend-following indicator. The MA20 and MA50 are short-term and medium-term indicators, respectively. In the case of $NTRN, the price closing above the MA20 but facing resistance at MA50 suggests a bullish short-term trend but a cautious medium-term outlook.
Navigating the Crypto Seas: A Word of Caution
While technical analysis can provide valuable insights, it’s not foolproof. The crypto market is volatile and unpredictable, influenced by a multitude of factors. Always remember to:
Charting Your Course
As we conclude our journey, remember that technical analysis is a tool, not a crystal ball. It can provide valuable insights, but it’s up to you to chart your course. Stay informed, stay cautious, and most importantly, stay curious. The crypto ocean is vast and full of opportunities. Happy sailing!
—
Sources