Crypto Market Insights: A Multifaceted Analysis of Bitcoin (BTC) on March 24, 2025
Introduction
In the dynamic world of cryptocurrency, understanding market trends and patterns is akin to navigating a labyrinth, where each turn presents a new challenge and opportunity. As of March 24, 2025, Bitcoin (BTC), the granddaddy of all cryptocurrencies, finds itself in a state of flux, with traders and analysts offering a plethora of interpretations. Let’s delve into the multifaceted analysis of BTC on this day, drawing insights from various sources to paint a comprehensive picture.
The Bullish Narrative: Engulfing Patterns and Ascending Triangles
Bullish Engulfing and Rising Wedges
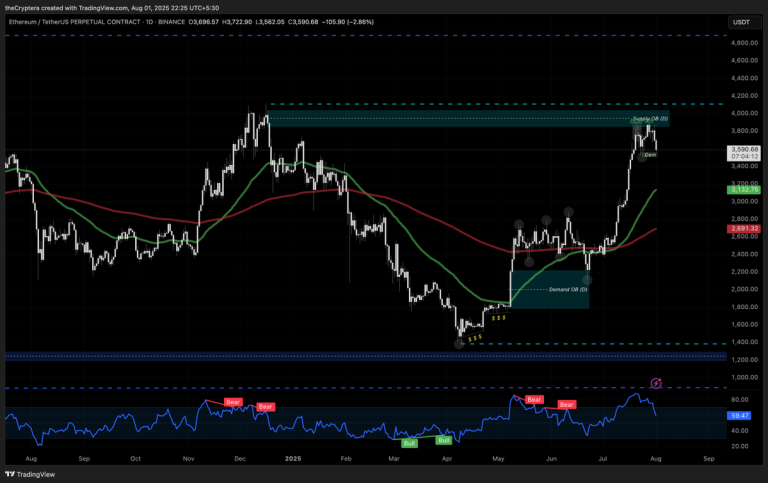
@crypto_trad1ng highlights a bullish engulfing pattern on the daily chart, with BTC closing above the uptrend line. This pattern suggests a potential trend reversal, as the price action engulfs the previous day’s bearish candle, indicating a shift in market sentiment. However, a rising wedge pattern is also forming, which is typically considered a bearish reversal pattern. This paradoxical situation hints at the market’s indecision, with bulls and bears locked in a tug-of-war.
Ascending Triangles and Ichimoku Clouds
@coingape_daily and @CoinGapeMedia both point out that BTC is bouncing off an ascending triangle support, with the Ichimoku Cloud signaling bullish momentum. Ascending triangles are continuation patterns that suggest the current trend will resume once the price breaks out of the triangle. The Ichimoku Cloud, a versatile indicator that defines support and resistance, as well as trend direction, is backing the bulls in this instance. A breakout with substantial volume could propel BTC higher, according to these sources.
The Bearish Counterpoint: Weak Indicators and Short Setups
On-Balance Volume (OBV) and Relative Strength Index (RSI)
@crypto_trad1ng also notes that the On-Balance Volume (OBV) is showing weak volume, and the Relative Strength Index (RSI) is bullish, but not overly so. These indicators suggest that while there is some buying pressure, it is not overwhelming, and the market may be vulnerable to a pullback.
Short Setups and Resistance Levels
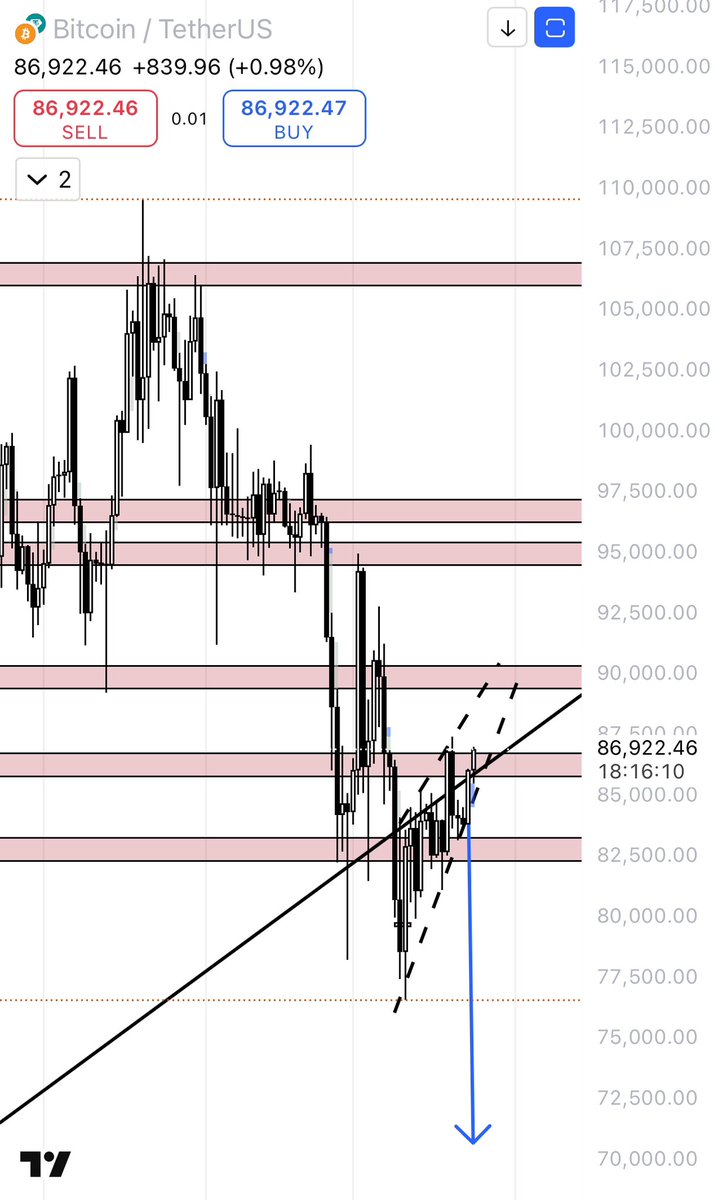
@MandaCoin_X shares a 15-minute chart analysis, identifying a short setup for BTC/USDT. This analysis suggests that BTC may face resistance at certain levels, making it an opportune time for traders to consider short positions. Additionally, @neoweka provides a long/buy entry point for AUDIO/USDT, with a target price significantly higher than the entry point, indicating a potential opportunity for long positions.
Conclusion: Market Indecision and Opportunity
Navigating the Market Maze
The multifaceted analysis of BTC on March 24, 2025, reveals a market in a state of indecision, with bullish and bearish signals cancelling each other out. This situation presents both challenges and opportunities for traders, as the market’s next move remains uncertain. To navigate this market maze, traders must remain vigilant, keeping a close eye on price action and key indicators, and being prepared to adapt their strategies as the market dictates.
Sources