Unraveling the Mystery of Back-to-Back Weekly Hammer Candles in Bitcoin
Introduction: A Rare Phenomenon in Bitcoin
Bitcoin, the world’s most popular cryptocurrency, has recently experienced a rare and intriguing phenomenon: back-to-back weekly hammer candles. This occurrence is not only visually striking on charts but also holds significant implications for traders and investors. In this report, we will delve into what these hammer candles mean, their historical context, and what they might signal for Bitcoin’s future.
Understanding Hammer Candles
A hammer candle is a type of candlestick pattern where the lower or upper wick makes up a substantial portion of the total price range, typically 90% or more, leaving a small body at the top or bottom[1]. This pattern is often seen as a potential reversal signal, indicating that the market is trying to find a bottom or top.
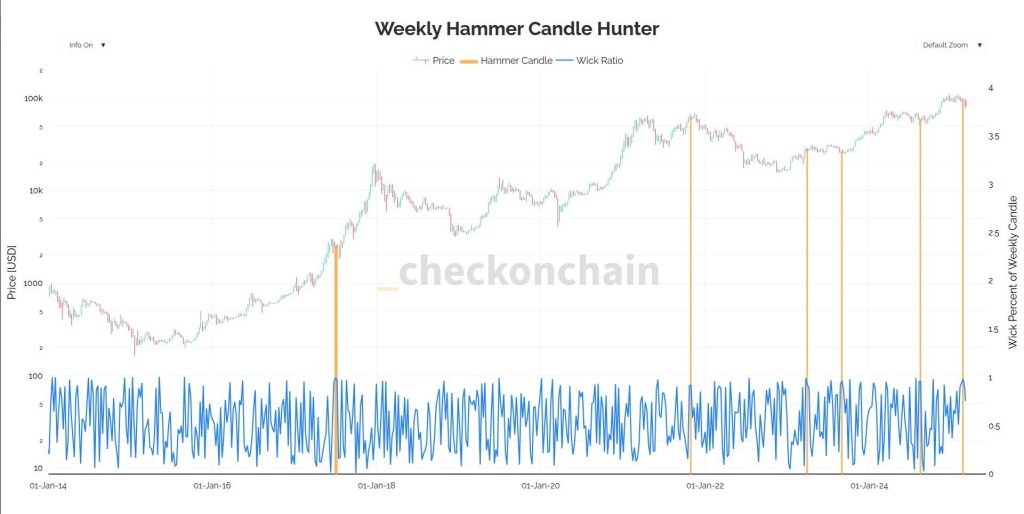
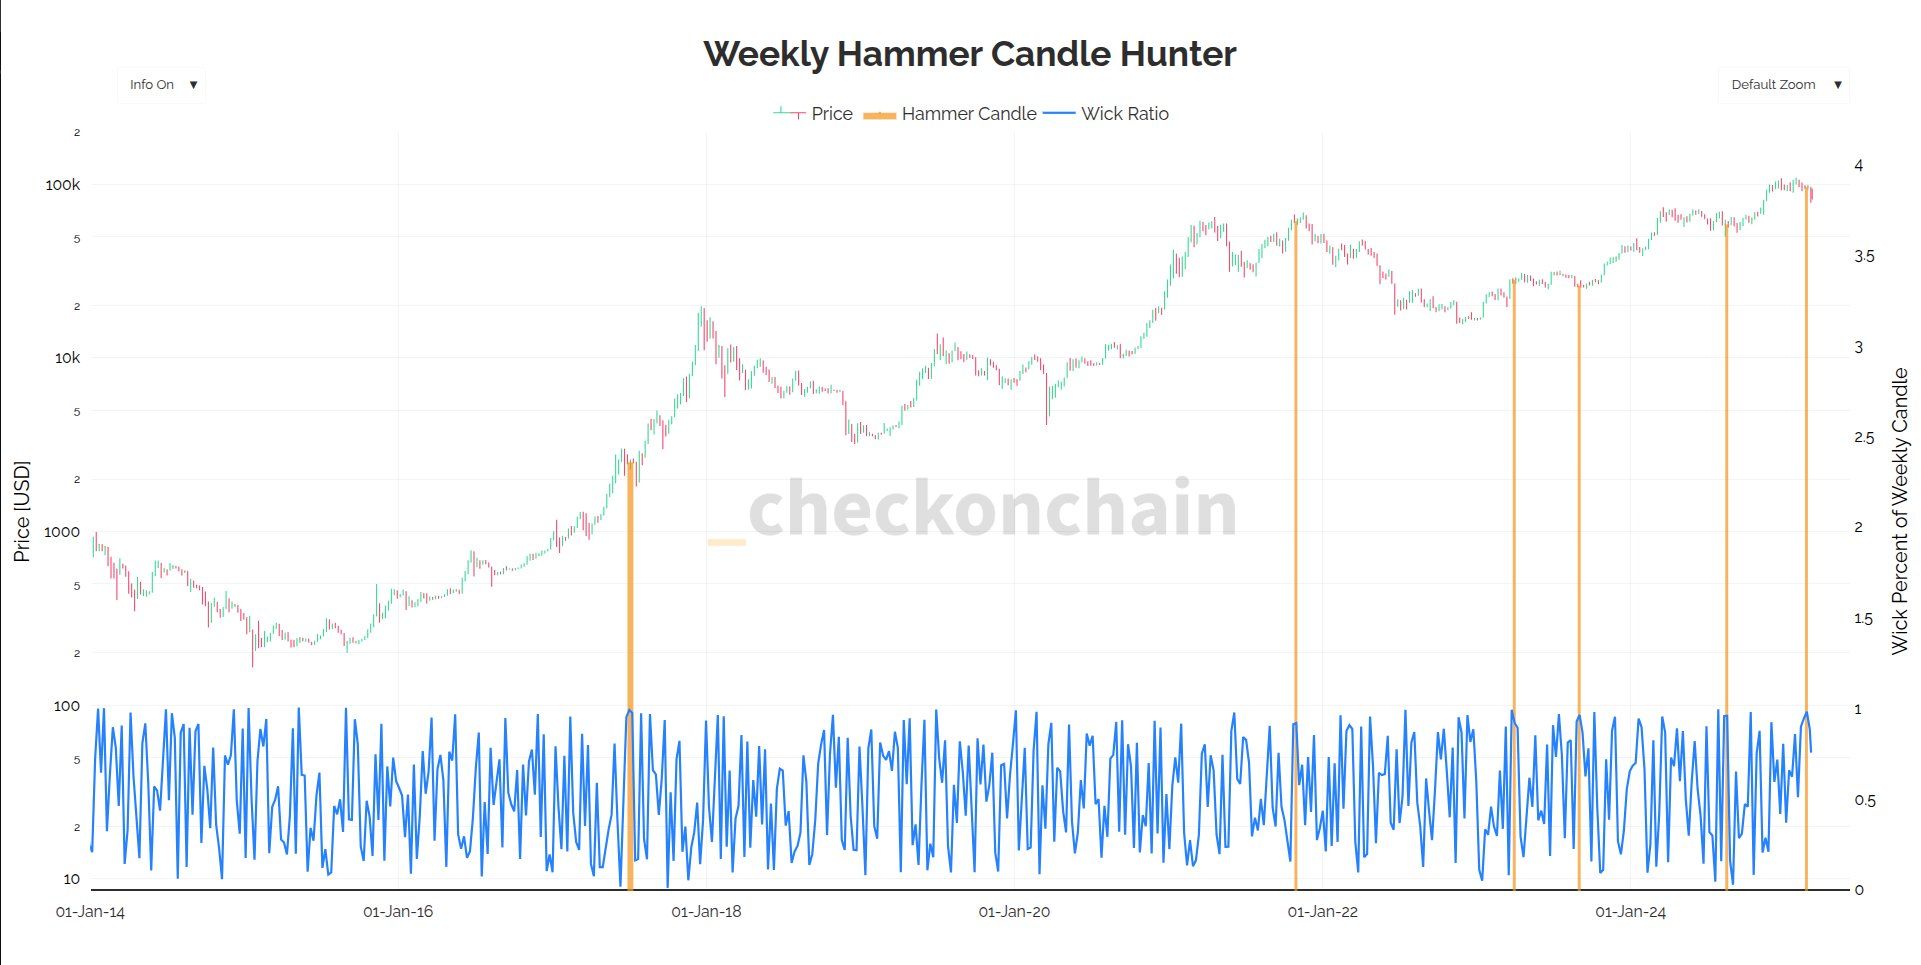
Historical Context: Only Five Instances
Checkmate’s analysis reveals that Bitcoin has formed a weekly hammer candle with a 90% lower wick only five times in its history[1]. These instances occurred during significant market events, such as the 2017 bull run, the late 2021 bull market peak, twice in 2023 following the Silicon Valley Bank crisis and the summer downturn, and once in 2024 during a summer lull[1]. The rarity of this pattern suggests that it could be a critical turning point in Bitcoin’s price trend.
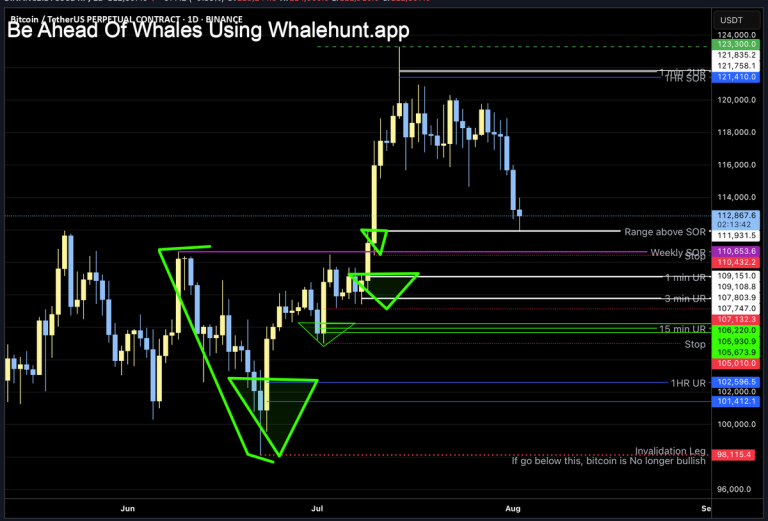
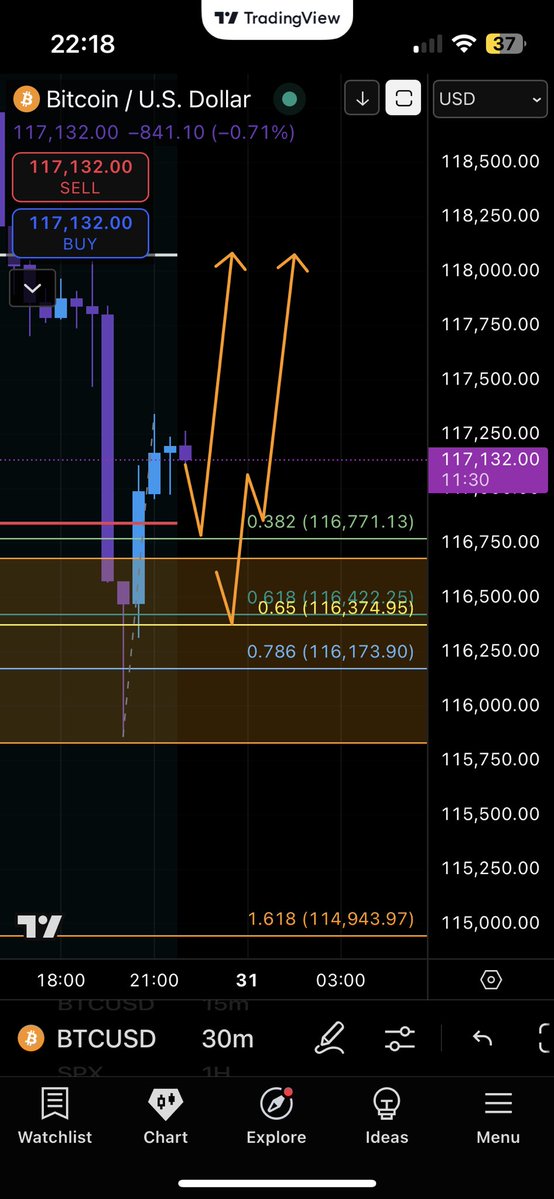
Recent Volatility and Market Dynamics
In the past two weeks, Bitcoin has experienced sharp price swings, with a 23% swing in one week and a 16% swing in the next[1]. These large movements reflect the high volatility that Bitcoin is known for, and the hammer candles are a visual representation of this volatility. Despite the fluctuations, Bitcoin remains in a bull cycle, according to CryptoQuant CEO Ki Young Ju, who believes that even a drop to $77,000 would not signal the end of this cycle[2].
Implications for Investors
The appearance of back-to-back hammer candles could signal a potential reversal or stabilization in Bitcoin’s price. However, it’s crucial for investors to consider other market factors, such as support levels. For instance, U.S. Bitcoin ETF investors have a cost basis of $89,000, which acts as a strong support level[2]. Additionally, Bitcoin miners face losses if the price falls below $57,000, a level that has historically marked the beginning of bear markets[2].
Conclusion: A Powerful Signal in Volatile Times
In summary, the back-to-back weekly hammer candles in Bitcoin are a rare and significant event. While they do not guarantee a specific outcome, they can indicate critical turning points in the market. As Bitcoin continues to navigate through volatile times, understanding these patterns can provide valuable insights for investors and traders alike. Whether Bitcoin is poised for a rebound or a further correction, one thing is clear: these hammer candles are a powerful signal that demands attention in the ever-changing landscape of cryptocurrency.
—