Introduction: The Ethereum Price Conundrum
The world of cryptocurrency is known for its unpredictability, and Ethereum, the second-largest cryptocurrency by market capitalization, is no exception. Recently, Ethereum’s price has been under scrutiny due to the formation of a “double top” pattern, a technical indicator that suggests a potential end to its bull market. This pattern hints at a significant price drop, potentially as much as 42%[1][5]. In this analysis, we will delve into what this means for Ethereum and its investors.
Understanding the Double Top Pattern
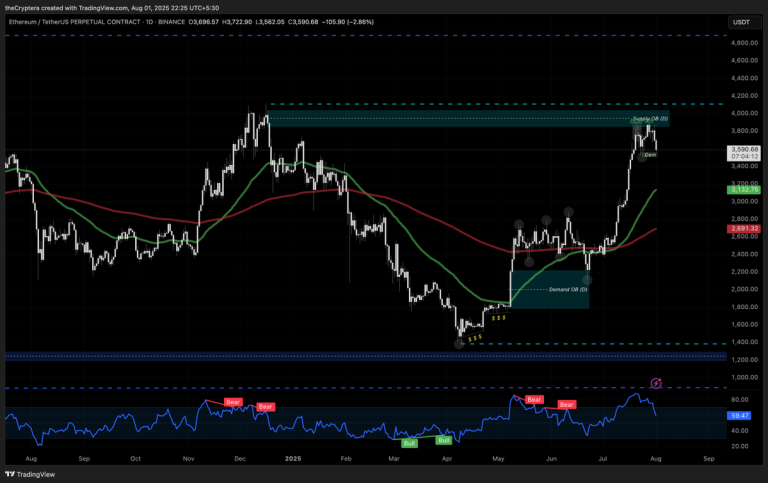
The double top pattern is a bearish reversal signal that forms when the price of an asset attempts to break through a resistance level twice but fails both times, creating two peaks at roughly the same price[1]. This pattern indicates that the upward momentum is exhausted, and sellers are gaining control. For Ethereum, the neckline of this pattern is around the $2,100 mark, and if the price breaks below this level, it could trigger a cascade of sell orders[1][5].
The Critical $2,000 Support Level
The $2,000 level is not just any number; it’s a significant psychological and technical support level for Ethereum. It has acted as a buffer in the past, preventing steeper declines. However, if Ethereum decisively breaks below $2,000, it could trigger panic selling and erode market confidence, potentially leading to a drop as low as $1,500[1][5].
On-Chain Data Offers Hope
While technical charts paint a bearish picture, on-chain data from Glassnode suggests there is robust demand for Ethereum around the $1,890 level. This indicates that there are still buyers eager to accumulate ETH at lower prices, which could act as a strong support level and prevent the anticipated price crash[1]. Key metrics include increased exchange outflows and rising accumulation addresses, pointing to long-term holding sentiment[1].
Market Sentiment and Volatility
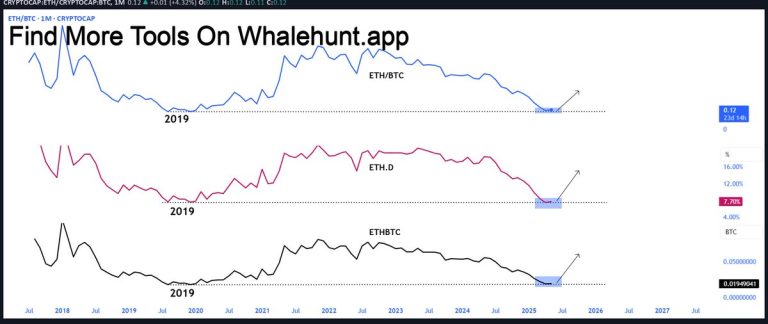
Ethereum’s price action is currently range-bound, and it could test the $2,300 support level before rebounding. However, if Ethereum fails to maintain the $2,600 level, it could lead to a steep correction[4]. The recent surge in whale activity centered around Ethereum suggests that the top altcoin could be in for a significant price movement in the near future[4].
Conclusion: Navigating Uncertainty
In conclusion, the double top pattern in Ethereum’s price chart is a warning sign for investors. While there are potential risks of a significant price drop, on-chain data suggests that there is still strong demand at lower levels. Investors should monitor key levels closely and consider risk management strategies to navigate this uncertainty. The coming days will be crucial in determining Ethereum’s next move: will the bears triumph, or will the bulls stage a comeback?
—
Sources:
– CoinStats
– Identosphere
– Blockchain News
– Ainvest
– Cointelegraph